Nokia 2012 Annual Report Download - page 262
Download and view the complete annual report
Please find page 262 of the 2012 Nokia annual report below. You can navigate through the pages in the report by either clicking on the pages listed below, or by using the keyword search tool below to find specific information within the annual report.-
 1
1 -
2
-
3
-
4
-
5
-
6
-
7
-
8
-
9
-
10
-
11
-
12
-
13
-
14
-
15
-
16
-
17
-
18
-
19
-
20
-
21
-
22
-
23
-
24
-
25
-
26
-
27
-
28
-
29
-
30
-
31
-
32
-
33
-
34
-
35
-
36
-
37
-
38
-
39
-
40
-
41
-
42
-
43
-
44
-
45
-
46
-
47
-
48
-
49
-
50
-
51
-
52
-
53
-
54
-
55
-
56
-
57
-
58
-
59
-
60
-
61
-
62
-
63
-
64
-
65
-
66
-
67
-
68
-
69
-
70
-
71
-
72
-
73
-
74
-
75
-
76
-
77
-
78
-
79
-
80
-
81
-
82
-
83
-
84
-
85
-
86
-
87
-
88
-
89
-
90
-
91
-
92
-
93
-
94
-
95
-
96
-
97
-
98
-
99
-
100
-
101
-
102
-
103
-
104
-
105
-
106
-
107
-
108
-
109
-
110
-
111
-
112
-
113
-
114
-
115
-
116
-
117
-
118
-
119
-
120
-
121
-
122
-
123
-
124
-
125
-
126
-
127
-
128
-
129
-
130
-
131
-
132
-
133
-
134
-
135
-
136
-
137
-
138
-
139
-
140
-
141
-
142
-
143
-
144
-
145
-
146
-
147
-
148
-
149
-
150
-
151
-
152
-
153
-
154
-
155
-
156
-
157
-
158
-
159
-
160
-
161
-
162
-
163
-
164
-
165
-
166
-
167
-
168
-
169
-
170
-
171
-
172
-
173
-
174
-
175
-
176
-
177
-
178
-
179
-
180
-
181
-
182
-
183
-
184
-
185
-
186
-
187
-
188
-
189
-
190
-
191
-
192
-
193
-
194
-
195
-
196
-
197
-
198
-
199
-
200
-
201
-
202
-
203
-
204
-
205
-
206
-
207
-
208
-
209
-
210
-
211
-
212
-
213
-
214
-
215
-
216
-
217
-
218
-
219
-
220
-
221
-
222
-
223
-
224
-
225
-
226
-
227
-
228
-
229
-
230
-
231
-
232
-
233
-
234
-
235
-
236
-
237
-
238
-
239
-
240
-
241
-
242
-
243
-
244
-
245
-
246
-
247
-
248
-
249
-
250
-
251
-
 252
252 -
 253
253 -
 254
254 -
 255
255 -
 256
256 -
 257
257 -
 258
258 -
 259
259 -
 260
260 -
 261
261 -
 262
262 -
 263
263 -
 264
264 -
 265
265 -
 266
266 -
 267
267 -
 268
268 -
 269
269 -
 270
270 -
 271
271 -
 272
272 -
273
-
274
-
275
-
276
-
277
-
278
-
279
-
280
-
281
-
282
-
283
-
284
 |
 |

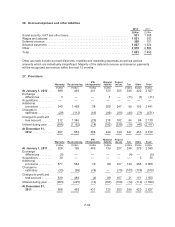
The fair value of the liability is determined based on the estimated fair value of shares less the exercise
price of the options on the reporting date. The total carrying amount for liabilities arising from share-
based payment transactions is EUR 11 million at December 31, 2012.
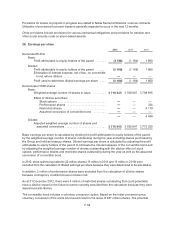
25. Deferred taxes
2012 2011
EURm EURm
Deferred tax assets:
Intercompany profit in inventory ...................................... 58 66
Tax losses carried forward and unused tax credits ....................... 564 715
Warranty provision ................................................. 47 63
Other provisions ................................................... 261 363
Depreciation differences ............................................ 868 711
Share-based compensation .......................................... —11
Other temporary differences ......................................... 145 362
Reclassification due to netting of deferred taxes ......................... (689) (443)
Total deferred tax assets .................................................... 1 254 1 848
Deferred tax liabilities:
Depreciation differences and untaxed reserves .......................... (892) (500)
Fair value gains/losses .............................................. —(65)
Undistributed earnings .............................................. (313) (268)
Other temporary differences(1) ........................................ (184) (410)
Reclassification due to netting of deferred taxes ......................... 689 443
Total deferred tax liabilities .................................................. (700) (800)
Net deferred tax asset ...................................................... 554 1 048
Tax charged to equity ...................................................... 3(4)
(1) In 2011, other temporary differences included a deferred tax liability of EUR 339 million arising
from purchase price allocation related to Nokia Siemens Networks and NAVTEQ. In 2012 the
deferred tax liabilities for these two items were nil.
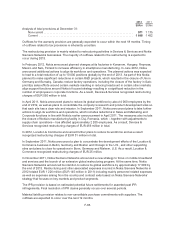
At December 31, 2012, the Group had tax losses carry forward of EUR 6 528 million (EUR 2
702 million in 2011) of which EUR 4 554 million will expire within 10 years (EUR 969 million in 2011).
At December 31, 2012, the Group had tax losses carry forward, temporary differences and tax credits
of EUR 10 294 million (EUR 4 302 million in 2011) for which no deferred tax asset was recognized due
to uncertainty of utilization of these items. EUR 4 392 million of those will expire within 10 years
(EUR 147 million in 2011).
The recognition of the remaining deferred tax assets is supported by offsetting deferred tax liabilities,
earnings history and profit projections in the relevant jurisdictions.
At December 31, 2012, the Group had undistributed earnings of EUR 347 million (EUR 424 million in
2011) on which no deferred tax liability has been formed as these will not reverse in the foreseeable
future.
F-61