Nokia 2012 Annual Report Download - page 276
Download and view the complete annual report
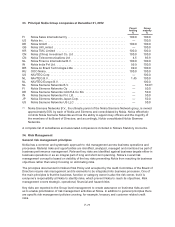
Please find page 276 of the 2012 Nokia annual report below. You can navigate through the pages in the report by either clicking on the pages listed below, or by using the keyword search tool below to find specific information within the annual report.-
 1
1 -
2
-
3
-
4
-
5
-
6
-
7
-
8
-
9
-
10
-
11
-
12
-
13
-
14
-
15
-
16
-
17
-
18
-
19
-
20
-
21
-
22
-
23
-
24
-
25
-
26
-
27
-
28
-
29
-
30
-
31
-
32
-
33
-
34
-
35
-
36
-
37
-
38
-
39
-
40
-
41
-
42
-
43
-
44
-
45
-
46
-
47
-
48
-
49
-
50
-
51
-
52
-
53
-
54
-
55
-
56
-
57
-
58
-
59
-
60
-
61
-
62
-
63
-
64
-
65
-
66
-
67
-
68
-
69
-
70
-
71
-
72
-
73
-
74
-
75
-
76
-
77
-
78
-
79
-
80
-
81
-
82
-
83
-
84
-
85
-
86
-
87
-
88
-
89
-
90
-
91
-
92
-
93
-
94
-
95
-
96
-
97
-
98
-
99
-
100
-
101
-
102
-
103
-
104
-
105
-
106
-
107
-
108
-
109
-
110
-
111
-
112
-
113
-
114
-
115
-
116
-
117
-
118
-
119
-
120
-
121
-
122
-
123
-
124
-
125
-
126
-
127
-
128
-
129
-
130
-
131
-
132
-
133
-
134
-
135
-
136
-
137
-
138
-
139
-
140
-
141
-
142
-
143
-
144
-
145
-
146
-
147
-
148
-
149
-
150
-
151
-
152
-
153
-
154
-
155
-
156
-
157
-
158
-
159
-
160
-
161
-
162
-
163
-
164
-
165
-
166
-
167
-
168
-
169
-
170
-
171
-
172
-
173
-
174
-
175
-
176
-
177
-
178
-
179
-
180
-
181
-
182
-
183
-
184
-
185
-
186
-
187
-
188
-
189
-
190
-
191
-
192
-
193
-
194
-
195
-
196
-
197
-
198
-
199
-
200
-
201
-
202
-
203
-
204
-
205
-
206
-
207
-
208
-
209
-
210
-
211
-
212
-
213
-
214
-
215
-
216
-
217
-
218
-
219
-
220
-
221
-
222
-
223
-
224
-
225
-
226
-
227
-
228
-
229
-
230
-
231
-
232
-
233
-
234
-
235
-
236
-
237
-
238
-
239
-
240
-
241
-
242
-
243
-
244
-
245
-
246
-
247
-
248
-
249
-
250
-
251
-
252
-
253
-
254
-
255
-
256
-
257
-
258
-
259
-
260
-
261
-
262
-
263
-
264
-
265
-
 266
266 -
 267
267 -
 268
268 -
 269
269 -
 270
270 -
 271
271 -
 272
272 -
 273
273 -
 274
274 -
 275
275 -
 276
276 -
 277
277 -
 278
278 -
 279
279 -
 280
280 -
 281
281 -
 282
282 -
 283
283 -
 284
284
 |
 |

2012 2011
EURm EURm
At December 31 .......................................................... 22 33
Average for the year ...................................................... 19 34
Range for the year ........................................................ 9-44 19 - 45
Equity price risk
Nokia’s exposure to equity price risk is related to certain publicly listed equity shares.
The fair value of these investments at December 31, 2012 was EUR 11 million (EUR 7 million in 2011).
The VaR for the Group equity investment in publicly traded companies is insignificant.
(b) Credit Risk
Credit risk refers to the risk that a counterparty will default on its contractual obligations resulting in
financial loss to the Group. Credit risk arises from credit exposures to customers, including outstanding
receivables, financial guarantees and committed transactions as well as financial institutions, including
bank and cash, fixed income and money-market investments and derivative financial instruments.
Credit risk is managed separately for business related and financial credit exposures.
Except as detailed in the following table, the maximum exposure to credit risk is limited to the book
value of the financial assets as included in the Group’s balance sheet:
2012 2011
EURm EURm
Financial guarantees given on behalf of customers and other third parties ........ 12 —
Loan commitments given but not used ..................................... 34 86
46 86
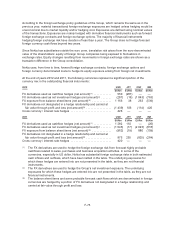
Business Related Credit Risk
The Group aims to ensure highest possible quality in accounts receivable and loans due from
customers and other third parties. Nokia and Nokia Siemens Networks Credit Policies (both approved
by the respective Leadership Teams) lay out the framework for the management of the business
related credit risks in Nokia and Nokia Siemens Networks.
Nokia and Nokia Siemens Networks Credit Policies provide that credit decisions are based on credit
evaluation including credit rating for larger exposures. Nokia and Nokia Siemens Networks Rating
Policies define the rating principles. Ratings are approved by Nokia and Nokia Siemens Networks
Rating Committees. Credit risks are approved and monitored according to the credit policy of each
business entity. When appropriate, credit risks are mitigated with the use of approved instruments,
such as letters of credit, collateral or insurance and sale of selected receivables.
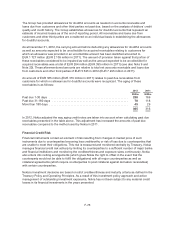
Credit exposure is measured as the total of accounts receivable and loans outstanding due from
customers and other third parties, and committed credits.
The accounts receivable do not include any major concentrations of credit risk by customer or by
geography. Top three customers account for approximately 7.0%, 2.5% and 2.1% (3.2%, 2.3% and
1.9% in 2011) of Group accounts receivable and loans due from customers and other third parties as
at December 31, 2012, while the top three credit exposures by country amounted to 9.5%, 8.5% and
7.5% (10.6%, 7.5% and 4.4% in 2011).
F-75