Nokia 2012 Annual Report Download - page 115
Download and view the complete annual report
Please find page 115 of the 2012 Nokia annual report below. You can navigate through the pages in the report by either clicking on the pages listed below, or by using the keyword search tool below to find specific information within the annual report.-
 1
1 -
2
-
3
-
4
-
5
-
6
-
7
-
8
-
9
-
10
-
11
-
12
-
13
-
14
-
15
-
16
-
17
-
18
-
19
-
20
-
21
-
22
-
23
-
24
-
25
-
26
-
27
-
28
-
29
-
30
-
31
-
32
-
33
-
34
-
35
-
36
-
37
-
38
-
39
-
40
-
41
-
42
-
43
-
44
-
45
-
46
-
47
-
48
-
49
-
50
-
51
-
52
-
53
-
54
-
55
-
56
-
57
-
58
-
59
-
60
-
61
-
62
-
63
-
64
-
65
-
66
-
67
-
68
-
69
-
70
-
71
-
72
-
73
-
74
-
75
-
76
-
77
-
78
-
79
-
80
-
81
-
82
-
83
-
84
-
85
-
86
-
87
-
88
-
89
-
90
-
91
-
92
-
93
-
94
-
95
-
96
-
97
-
98
-
99
-
100
-
101
-
102
-
103
-
104
-
 105
105 -
 106
106 -
 107
107 -
 108
108 -
 109
109 -
 110
110 -
 111
111 -
 112
112 -
 113
113 -
 114
114 -
 115
115 -
 116
116 -
 117
117 -
 118
118 -
 119
119 -
 120
120 -
 121
121 -
 122
122 -
 123
123 -
 124
124 -
 125
125 -
126
-
127
-
128
-
129
-
130
-
131
-
132
-
133
-
134
-
135
-
136
-
137
-
138
-
139
-
140
-
141
-
142
-
143
-
144
-
145
-
146
-
147
-
148
-
149
-
150
-
151
-
152
-
153
-
154
-
155
-
156
-
157
-
158
-
159
-
160
-
161
-
162
-
163
-
164
-
165
-
166
-
167
-
168
-
169
-
170
-
171
-
172
-
173
-
174
-
175
-
176
-
177
-
178
-
179
-
180
-
181
-
182
-
183
-
184
-
185
-
186
-
187
-
188
-
189
-
190
-
191
-
192
-
193
-
194
-
195
-
196
-
197
-
198
-
199
-
200
-
201
-
202
-
203
-
204
-
205
-
206
-
207
-
208
-
209
-
210
-
211
-
212
-
213
-
214
-
215
-
216
-
217
-
218
-
219
-
220
-
221
-
222
-
223
-
224
-
225
-
226
-
227
-
228
-
229
-
230
-
231
-
232
-
233
-
234
-
235
-
236
-
237
-
238
-
239
-
240
-
241
-
242
-
243
-
244
-
245
-
246
-
247
-
248
-
249
-
250
-
251
-
252
-
253
-
254
-
255
-
256
-
257
-
258
-
259
-
260
-
261
-
262
-
263
-
264
-
265
-
266
-
267
-
268
-
269
-
270
-
271
-
272
-
273
-
274
-
275
-
276
-
277
-
278
-
279
-
280
-
281
-
282
-
283
-
284
 |
 |

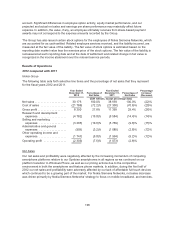
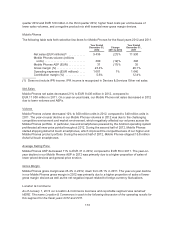
The following table sets forth selective line items and the percentage of net sales that they represent
for Location & Commerce for the fiscal years 2012 and 2011.
Year Ended
December 31,
2012
Percentage of
Net Sales
Year Ended
December 31,
2011
Percentage of
Net Sales
Percentage
Increase/
(Decrease)
(EUR millions, except percentage data)
Net sales ..................... 1103 100.0% 1 091 100.0% 1%
Cost of sales ................. (228) (20.7)% (214) (19.6)% 7%
Gross profit ................... 875 79.3% 877 80.4% 0%
Research and development
expenses .................. (883) (80.0)% (958) (87.8)% (8)%
Selling and marketing
expenses .................. (186) (16.9)% (259) (23.7)% (28)%
Administrative and general
expenses .................. (77) (7.0)% (68) (6.3)% 13%
Other operating income and
expenses .................. (30) (2.7)% (1 118) (102.5)%
Operating profit ............... (301) (27.3)% (1 526) (139.9)%
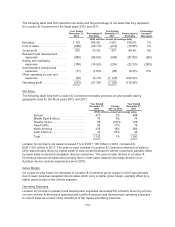
Net Sales
The following table sets forth Location & Commerce net sales and year-on-year growth rate by
geographic area for the fiscal years 2012 and 2011.
Year Ended
December 31,
2012
Change
2011 to 2012
Year Ended
December 31,
2011
(EUR millions, except percentage data)
Europe ........................... 477 2% 488
Middle East & Africa ................ 74 0% 74
Greater China ...................... 63 (51)% 128
Asia-Pacific ........................ 82 11% 74
North America ..................... 335 18% 284
Latin America ...................... 72 67% 43
Total ............................. 1103 1% 1091
Location & Commerce net sales increased 1% to EUR 1 103 million in 2012, compared to
EUR 1 091 million in 2011. The year-on-year increase in Location & Commerce external net sales in
2012 was primarily driven by higher sales of map content licenses to vehicle customers, partially offset
by lower sales to personal navigation devices customers. The year-on-year decline in Location &
Commerce internal net sales was primarily due to lower sales related to the large decline in our
Symbian device volumes experienced since 2010.
Gross Margin
On a year-on-year basis, the decrease in Location & Commerce gross margin in 2012 was primarily
due to lower personal navigation device sales which carry a higher gross margin, partially offset by a
higher gross margin in the vehicle segment.
Operating Expenses
Location & Commerce research and development expenses decreased 8% primarily driven by a focus
on cost controls, lower project spending and a shift of research and development operating expenses
to cost of sales as a result of the divestiture of the media advertising business.
114