Nokia 2012 Annual Report Download - page 112
Download and view the complete annual report
Please find page 112 of the 2012 Nokia annual report below. You can navigate through the pages in the report by either clicking on the pages listed below, or by using the keyword search tool below to find specific information within the annual report.-
 1
1 -
2
-
3
-
4
-
5
-
6
-
7
-
8
-
9
-
10
-
11
-
12
-
13
-
14
-
15
-
16
-
17
-
18
-
19
-
20
-
21
-
22
-
23
-
24
-
25
-
26
-
27
-
28
-
29
-
30
-
31
-
32
-
33
-
34
-
35
-
36
-
37
-
38
-
39
-
40
-
41
-
42
-
43
-
44
-
45
-
46
-
47
-
48
-
49
-
50
-
51
-
52
-
53
-
54
-
55
-
56
-
57
-
58
-
59
-
60
-
61
-
62
-
63
-
64
-
65
-
66
-
67
-
68
-
69
-
70
-
71
-
72
-
73
-
74
-
75
-
76
-
77
-
78
-
79
-
80
-
81
-
82
-
83
-
84
-
85
-
86
-
87
-
88
-
89
-
90
-
91
-
92
-
93
-
94
-
95
-
96
-
97
-
98
-
99
-
100
-
101
-
 102
102 -
 103
103 -
 104
104 -
 105
105 -
 106
106 -
 107
107 -
 108
108 -
 109
109 -
 110
110 -
 111
111 -
 112
112 -
 113
113 -
 114
114 -
 115
115 -
 116
116 -
 117
117 -
 118
118 -
 119
119 -
 120
120 -
 121
121 -
 122
122 -
123
-
124
-
125
-
126
-
127
-
128
-
129
-
130
-
131
-
132
-
133
-
134
-
135
-
136
-
137
-
138
-
139
-
140
-
141
-
142
-
143
-
144
-
145
-
146
-
147
-
148
-
149
-
150
-
151
-
152
-
153
-
154
-
155
-
156
-
157
-
158
-
159
-
160
-
161
-
162
-
163
-
164
-
165
-
166
-
167
-
168
-
169
-
170
-
171
-
172
-
173
-
174
-
175
-
176
-
177
-
178
-
179
-
180
-
181
-
182
-
183
-
184
-
185
-
186
-
187
-
188
-
189
-
190
-
191
-
192
-
193
-
194
-
195
-
196
-
197
-
198
-
199
-
200
-
201
-
202
-
203
-
204
-
205
-
206
-
207
-
208
-
209
-
210
-
211
-
212
-
213
-
214
-
215
-
216
-
217
-
218
-
219
-
220
-
221
-
222
-
223
-
224
-
225
-
226
-
227
-
228
-
229
-
230
-
231
-
232
-
233
-
234
-
235
-
236
-
237
-
238
-
239
-
240
-
241
-
242
-
243
-
244
-
245
-
246
-
247
-
248
-
249
-
250
-
251
-
252
-
253
-
254
-
255
-
256
-
257
-
258
-
259
-
260
-
261
-
262
-
263
-
264
-
265
-
266
-
267
-
268
-
269
-
270
-
271
-
272
-
273
-
274
-
275
-
276
-
277
-
278
-
279
-
280
-
281
-
282
-
283
-
284
 |
 |

Gross Margin
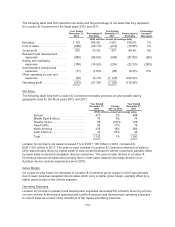
Our Devices & Services gross margin in 2012 was 21.3%, compared to 27.7% in 2011. On a year-on-
year basis, the decline in our Devices & Services gross margin in 2012 was due to gross margin
declines in Smart Devices and to a lesser degree in Mobile Phones and Devices & Services Other.
Operating Expenses
Devices & Services operating expenses decreased 20% year-on-year in 2012. On a year-on-year
basis, operating expenses related to Smart Devices decreased 32% in 2012, where Mobile Phones
remained approximately on the same level. In addition to the factors described below, the year-on-year
changes were affected by the proportionate allocation of operating expenses being affected by the
relative mix of sales and gross profit performance between Mobile Phones and Smart Devices. This
resulted in higher and lower relative allocations to Mobile Phones and Smart Devices, respectively.
Devices & Services research and development expenses decreased 24% year-on-year in 2012 due to
declines in Smart Devices and Devices & Services Other research and development expenses. The
decreases in research and development expenses were due primarily to a focus on priority projects
and cost controls as well as business divestments.
Devices & Services sales and marketing expenses decreased 15% year-on-year in 2012 primarily due
to lower overall business activity, improved efficiency in general marketing activities and business
divestments.
Devices & Services administrative and general expenses decreased 19% year-on-year in 2012,
primarily due structural cost savings as well as business divestments.
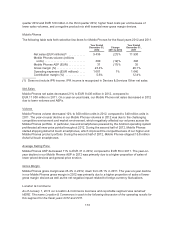
In 2012, Devices & Services other income and expense had a negative year-on-year impact on
profitability. In 2012, we recognized special items of net EUR 393 million in Devices and Services
Other, comprised of restructuring charges of EUR 550 million and related impairments of EUR
30 million, a benefit from cartel claim settlements of EUR 56 million, a net gain from the sale of a real
estate of EUR 79 million and a net gain from the divestment of the Vertu business of EUR 52 million. In
2011, we recognized special items of net EUR 287 million in Devices and Services Other, comprised of
restructuring charges of EUR 456 million, impairment of assets of EUR 90 million, Accenture deal
consideration of EUR 251 million, impairment of shares in an associated company of EUR 41 million
and a benefit from a cartel claim settlement of EUR 49 million.
Cost Reduction Activities and Planned Operational Adjustments
We continue to target to reduce our Devices & Services operating expenses to an annualized run rate
of approximately EUR 3.0 billion, excluding special items and purchase price accounting related items,
by the end of 2013.
In June, 2012, we announced additional restructuring measures to those announced in 2011, including
targeted investments in key growth areas, operational changes, divestment of non-core assets and
significantly increased our cost reduction target. The measures included the closure of our
manufacturing facility in Salo, Finland as well as the closure of our research and development facilities
in Ulm, Germany and Burnaby, Canada. We also focused our sales and marketing activities and
streamlined its information technology corporate and support functions to align with the sharpened
strategy. In addition, we completed the divestment of Vertu and our headquarters building in Finland.
As of December 31, 2012, we had recognized cumulative net charges in Devices & Services in 2011
and 2012 of approximately EUR 1.4 billion related to restructuring activities, which included
restructuring charges and associated impairments. While the total extent of the restructuring activities
111