Nokia 2012 Annual Report Download - page 119
Download and view the complete annual report
Please find page 119 of the 2012 Nokia annual report below. You can navigate through the pages in the report by either clicking on the pages listed below, or by using the keyword search tool below to find specific information within the annual report.-
 1
1 -
2
-
3
-
4
-
5
-
6
-
7
-
8
-
9
-
10
-
11
-
12
-
13
-
14
-
15
-
16
-
17
-
18
-
19
-
20
-
21
-
22
-
23
-
24
-
25
-
26
-
27
-
28
-
29
-
30
-
31
-
32
-
33
-
34
-
35
-
36
-
37
-
38
-
39
-
40
-
41
-
42
-
43
-
44
-
45
-
46
-
47
-
48
-
49
-
50
-
51
-
52
-
53
-
54
-
55
-
56
-
57
-
58
-
59
-
60
-
61
-
62
-
63
-
64
-
65
-
66
-
67
-
68
-
69
-
70
-
71
-
72
-
73
-
74
-
75
-
76
-
77
-
78
-
79
-
80
-
81
-
82
-
83
-
84
-
85
-
86
-
87
-
88
-
89
-
90
-
91
-
92
-
93
-
94
-
95
-
96
-
97
-
98
-
99
-
100
-
101
-
102
-
103
-
104
-
105
-
106
-
107
-
108
-
 109
109 -
 110
110 -
 111
111 -
 112
112 -
 113
113 -
 114
114 -
 115
115 -
 116
116 -
 117
117 -
 118
118 -
 119
119 -
 120
120 -
 121
121 -
 122
122 -
 123
123 -
 124
124 -
 125
125 -
 126
126 -
 127
127 -
 128
128 -
 129
129 -
130
-
131
-
132
-
133
-
134
-
135
-
136
-
137
-
138
-
139
-
140
-
141
-
142
-
143
-
144
-
145
-
146
-
147
-
148
-
149
-
150
-
151
-
152
-
153
-
154
-
155
-
156
-
157
-
158
-
159
-
160
-
161
-
162
-
163
-
164
-
165
-
166
-
167
-
168
-
169
-
170
-
171
-
172
-
173
-
174
-
175
-
176
-
177
-
178
-
179
-
180
-
181
-
182
-
183
-
184
-
185
-
186
-
187
-
188
-
189
-
190
-
191
-
192
-
193
-
194
-
195
-
196
-
197
-
198
-
199
-
200
-
201
-
202
-
203
-
204
-
205
-
206
-
207
-
208
-
209
-
210
-
211
-
212
-
213
-
214
-
215
-
216
-
217
-
218
-
219
-
220
-
221
-
222
-
223
-
224
-
225
-
226
-
227
-
228
-
229
-
230
-
231
-
232
-
233
-
234
-
235
-
236
-
237
-
238
-
239
-
240
-
241
-
242
-
243
-
244
-
245
-
246
-
247
-
248
-
249
-
250
-
251
-
252
-
253
-
254
-
255
-
256
-
257
-
258
-
259
-
260
-
261
-
262
-
263
-
264
-
265
-
266
-
267
-
268
-
269
-
270
-
271
-
272
-
273
-
274
-
275
-
276
-
277
-
278
-
279
-
280
-
281
-
282
-
283
-
284
 |
 |

part of the market. For Nokia Siemens Networks, net sales growth was driven primarily by the
contribution from the acquired Motorola Solutions network infrastructure assets, which was completed
In April, 2011. On a year-on-year basis the movement of the euro relative to relevant currencies had
almost no impact on our overall net sales.
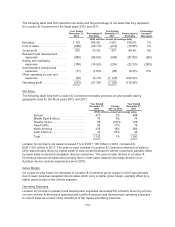
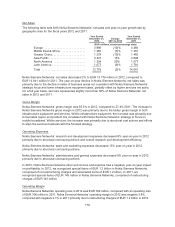
The following table sets forth the distribution by geographical area of our net sales for the fiscal years
2011 and 2010.
Year Ended December 31,
2011 2010
Europe ........................................... 31% 34%
Middle East & Africa ................................ 14% 13%
Greater China ..................................... 17% 18%
Asia-Pacific ....................................... 23% 21%
North America ..................................... 4% 5%
Latin America ...................................... 11% 9%
Total ............................................. 100% 100%
The 10 markets in which we generated the greatest net sales in 2011 were, in descending order of
magnitude, China, India, Brazil, Russia, Germany, Japan, the United States, the United Kingdom, Italy
and Spain, together representing approximately 52% of total net sales in 2011. In comparison, the
10 markets in which we generated the greatest net sales in 2010 were China, India, Germany, Russia,
the United States, Brazil, the United Kingdom, Spain, Italy and Indonesia, together representing
approximately 52% of total net sales in 2010.
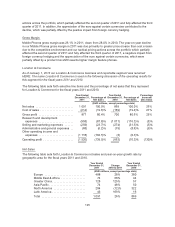
Gross Margin
Our gross margin in 2011 was 29.4%, compared to 30.6% in 2010. The lower gross margin in 2011
resulted primarily from the decrease in gross margin in Devices & Services compared to 2010, which
was partially offset by increased gross margin in Nokia Siemens Networks.
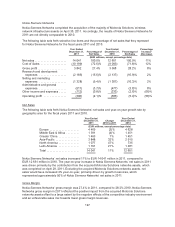
Operating Expenses
Our research and development (“R&D”) expenses were EUR 5 584 million in 2011, compared to
EUR (5 844) million in 2010. Research and development costs represented 14.4% of our net sales in
2011 compared to 13.8% in 2010. The increase in research and development expenses as a
percentage of net sales largely resulted from a relative decline in net sales in 2011 compared to an
increase in net sales and a decrease in research and development expenses in 2010. Research and
development expenses included purchase price accounting items of EUR 412 million in 2011
compared to EUR 556 million in 2010. At December 31, 2011, we employed 34 876 people in research
and development, representing approximately 27% of our total workforce, and had a strong research
and development presence in 16 countries.
In 2011, our selling and marketing expenses were EUR 3 769 million, compared to EUR 3 856 million
in 2010. Selling and marketing expenses represented 9.8% of our net sales in 2011 compared to 9.1%
in 2010. The increase in selling and marketing expenses as a percentage of net sales reflected a
decline in net sales in 2011 compared to an increase in net sales and a decrease in selling and
marketing expenses in 2010. Selling and marketing expenses included purchase price accounting
items of EUR 422 million in 2011 compared to EUR 408 million in 2010.
Administrative and general expenses were EUR 1 085 million in 2011, compared to EUR 1 039 million
2010. Administrative and general expenses were equal to 2.8% of our net sales in 2011 compared to
118