Nokia 2012 Annual Report Download - page 82
Download and view the complete annual report
Please find page 82 of the 2012 Nokia annual report below. You can navigate through the pages in the report by either clicking on the pages listed below, or by using the keyword search tool below to find specific information within the annual report.-
 1
1 -
2
-
3
-
4
-
5
-
6
-
7
-
8
-
9
-
10
-
11
-
12
-
13
-
14
-
15
-
16
-
17
-
18
-
19
-
20
-
21
-
22
-
23
-
24
-
25
-
26
-
27
-
28
-
29
-
30
-
31
-
32
-
33
-
34
-
35
-
36
-
37
-
38
-
39
-
40
-
41
-
42
-
43
-
44
-
45
-
46
-
47
-
48
-
49
-
50
-
51
-
52
-
53
-
54
-
55
-
56
-
57
-
58
-
59
-
60
-
61
-
62
-
63
-
64
-
65
-
66
-
67
-
68
-
69
-
70
-
71
-
 72
72 -
 73
73 -
 74
74 -
 75
75 -
 76
76 -
 77
77 -
 78
78 -
 79
79 -
 80
80 -
 81
81 -
 82
82 -
 83
83 -
 84
84 -
 85
85 -
 86
86 -
 87
87 -
 88
88 -
 89
89 -
 90
90 -
 91
91 -
 92
92 -
93
-
94
-
95
-
96
-
97
-
98
-
99
-
100
-
101
-
102
-
103
-
104
-
105
-
106
-
107
-
108
-
109
-
110
-
111
-
112
-
113
-
114
-
115
-
116
-
117
-
118
-
119
-
120
-
121
-
122
-
123
-
124
-
125
-
126
-
127
-
128
-
129
-
130
-
131
-
132
-
133
-
134
-
135
-
136
-
137
-
138
-
139
-
140
-
141
-
142
-
143
-
144
-
145
-
146
-
147
-
148
-
149
-
150
-
151
-
152
-
153
-
154
-
155
-
156
-
157
-
158
-
159
-
160
-
161
-
162
-
163
-
164
-
165
-
166
-
167
-
168
-
169
-
170
-
171
-
172
-
173
-
174
-
175
-
176
-
177
-
178
-
179
-
180
-
181
-
182
-
183
-
184
-
185
-
186
-
187
-
188
-
189
-
190
-
191
-
192
-
193
-
194
-
195
-
196
-
197
-
198
-
199
-
200
-
201
-
202
-
203
-
204
-
205
-
206
-
207
-
208
-
209
-
210
-
211
-
212
-
213
-
214
-
215
-
216
-
217
-
218
-
219
-
220
-
221
-
222
-
223
-
224
-
225
-
226
-
227
-
228
-
229
-
230
-
231
-
232
-
233
-
234
-
235
-
236
-
237
-
238
-
239
-
240
-
241
-
242
-
243
-
244
-
245
-
246
-
247
-
248
-
249
-
250
-
251
-
252
-
253
-
254
-
255
-
256
-
257
-
258
-
259
-
260
-
261
-
262
-
263
-
264
-
265
-
266
-
267
-
268
-
269
-
270
-
271
-
272
-
273
-
274
-
275
-
276
-
277
-
278
-
279
-
280
-
281
-
282
-
283
-
284
 |
 |

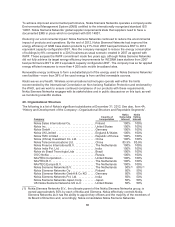
4D. Property, Plants and Equipment
At December 31, 2012, we operated seven manufacturing facilities in six countries for the production of
Nokia-branded mobile devices, and Nokia Siemens Networks had ten manufacturing facilities in four
countries. We consider the production capacity of our manufacturing facilities to be sufficient to meet
the requirements of our devices and networks infrastructure business. The extent of utilization of our
manufacturing facilities varies from plant to plant and from time to time during the year. None of these
facilities is subject to a material encumbrance.
The following is a list of the location, use and capacity of major manufacturing facilities for Nokia mobile
devices and Nokia Siemens Networks infrastructure equipment at December 31, 2012. In connection
with the implementation of our strategy for our Devices & Services business, we have announced a
number of changes to our operations resulting in the closure and reconfiguration of certain Nokia
facilities. See, Item 4B. “Business Overview – Devices & Services and HERE – Production.”
Country Location and Products
Productive
Capacity, Net
(m2)(1)
BRAZIL ................ Manaus: mobile devices 9 026
CHINA ................ Beijing: mobile devices 29 272
Dongguan: mobile devices 25 644
Beijing: switching systems 6 749
Shanghai: base stations, broadband
access systems, transmission systems 15 954
Suzhou: base stations 8 940
Tianjin: Wireless base stations, mobile core
systems, radio controllers, broadband
access equipment 10 000
FINLAND .............. Oulu: base stations 16 000
GERMANY ............. Berlin: optical transmission systems 15 011
Bruchsal: switching systems, transmission
systems, broadband access systems 18 815
HUNGARY ............. Komárom: mobile devices 12 150
INDIA ................. Chennai: mobile devices 35 323
Chennai: base stations and radio
controllers, microwave radio products. 8 364
Kolkata: fixed switching 3 457
MEXICO ............... Reynosa: mobile devices 8 889
REPUBLIC OF KOREA . . Masan: mobile devices 3 743
RUSSIA ............... Tomsk: base stations 1 494
(1) Productive capacity equals the total area allotted to manufacturing and to the storage of
manufacturing-related materials.
ITEM 4A. UNRESOLVED STAFF COMMENTS
Not applicable.
ITEM 5. OPERATING AND FINANCIAL REVIEW AND PROSPECTS
5A. Operating Results
This section begins with an overview of the principal factors and trends affecting our results of
operations. The overview is followed by a discussion of our critical accounting policies and estimates
that we believe are important to understanding the assumptions and judgments reflected in our
reported financial results. We then present an analysis of our results of operations for the last three
fiscal years.
81