Nokia 2012 Annual Report Download - page 10
Download and view the complete annual report
Please find page 10 of the 2012 Nokia annual report below. You can navigate through the pages in the report by either clicking on the pages listed below, or by using the keyword search tool below to find specific information within the annual report.-
 1
1 -
 2
2 -
 3
3 -
 4
4 -
 5
5 -
 6
6 -
 7
7 -
 8
8 -
 9
9 -
 10
10 -
 11
11 -
 12
12 -
 13
13 -
 14
14 -
 15
15 -
 16
16 -
 17
17 -
 18
18 -
 19
19 -
 20
20 -
 21
21 -
22
-
23
-
24
-
25
-
26
-
27
-
28
-
29
-
30
-
31
-
32
-
33
-
34
-
35
-
36
-
37
-
38
-
39
-
40
-
41
-
42
-
43
-
44
-
45
-
46
-
47
-
48
-
49
-
50
-
51
-
52
-
53
-
54
-
55
-
56
-
57
-
58
-
59
-
60
-
61
-
62
-
63
-
64
-
65
-
66
-
67
-
68
-
69
-
70
-
71
-
72
-
73
-
74
-
75
-
76
-
77
-
78
-
79
-
80
-
81
-
82
-
83
-
84
-
85
-
86
-
87
-
88
-
89
-
90
-
91
-
92
-
93
-
94
-
95
-
96
-
97
-
98
-
99
-
100
-
101
-
102
-
103
-
104
-
105
-
106
-
107
-
108
-
109
-
110
-
111
-
112
-
113
-
114
-
115
-
116
-
117
-
118
-
119
-
120
-
121
-
122
-
123
-
124
-
125
-
126
-
127
-
128
-
129
-
130
-
131
-
132
-
133
-
134
-
135
-
136
-
137
-
138
-
139
-
140
-
141
-
142
-
143
-
144
-
145
-
146
-
147
-
148
-
149
-
150
-
151
-
152
-
153
-
154
-
155
-
156
-
157
-
158
-
159
-
160
-
161
-
162
-
163
-
164
-
165
-
166
-
167
-
168
-
169
-
170
-
171
-
172
-
173
-
174
-
175
-
176
-
177
-
178
-
179
-
180
-
181
-
182
-
183
-
184
-
185
-
186
-
187
-
188
-
189
-
190
-
191
-
192
-
193
-
194
-
195
-
196
-
197
-
198
-
199
-
200
-
201
-
202
-
203
-
204
-
205
-
206
-
207
-
208
-
209
-
210
-
211
-
212
-
213
-
214
-
215
-
216
-
217
-
218
-
219
-
220
-
221
-
222
-
223
-
224
-
225
-
226
-
227
-
228
-
229
-
230
-
231
-
232
-
233
-
234
-
235
-
236
-
237
-
238
-
239
-
240
-
241
-
242
-
243
-
244
-
245
-
246
-
247
-
248
-
249
-
250
-
251
-
252
-
253
-
254
-
255
-
256
-
257
-
258
-
259
-
260
-
261
-
262
-
263
-
264
-
265
-
266
-
267
-
268
-
269
-
270
-
271
-
272
-
273
-
274
-
275
-
276
-
277
-
278
-
279
-
280
-
281
-
282
-
283
-
284
 |
 |

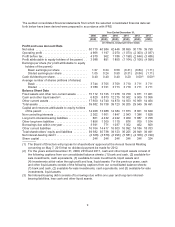
The audited consolidated financial statements from which the selected consolidated financial data set
forth below have been derived were prepared in accordance with IFRS.
Year Ended December 31,
2008 2009 2010 2011 2012 2012
(EUR) (EUR) (EUR) (EUR) (EUR) (USD)
(in millions, except per share data)
Profit and Loss Account Data
Net sales .................................. 50710 40984 42446 38659 30176 39790
Operating profit ............................. 4966 1197 2070 (1073) (2 303) (3 037)
Profit before tax ............................. 4970 962 1786 (1198) (2 644) (3 486)
Profit attributable to equity holders of the parent . . 3 988 891 1 850 (1 164) (3 106) (4 096)
Earnings per share (for profit attributable to equity
holders of the parent)
Basic earnings per share ................. 1.07 0.24 0.50 (0.31) (0.84) (1.11)
Diluted earnings per share ................ 1.05 0.24 0.50 (0.31) (0.84) (1.11)
Cash dividends per share ..................... 0.40 0.40 0.40 0.20 0.00(1) 0.00(1)
Average number of shares (millions of shares)
Basic .................................. 3744 3705 3709 3710 3711 3711
Diluted ................................ 3780 3721 3713 3710 3711 3711
Balance Sheet Data
Fixed assets and other non-current assets ....... 15112 12125 11978 10750 9071 11961
Cash and other liquid assets(2) ................. 6820 8873 12275 10902 9909 13066
Other current assets ......................... 17650 14740 14870 14553 10969 14464
Total assets ................................ 39582 35738 39123 36205 29949 39491
Capital and reserves attributable to equity holders
of the parent ............................. 14208 13088 14384 11873 8061 10629
Non-controlling interests ...................... 2302 1661 1847 2043 1386 1828
Long-term interest-bearing liabilities ............ 861 4432 4242 3969 5087 6708
Other long-term liabilities ..................... 1856 1369 1110 876 769 1014
Borrowings due within one year ................ 3591 771 1037 1352 462 609
Other current liabilities ....................... 16764 14417 16503 16092 14184 18703
Total shareholders’ equity and liabilities ......... 39582 35738 39123 36205 29949 39491
Net interest-bearing debt(3) .................... (2368) (3 670) (6 996) (5 581) (4 360) (5 749)
Share capital ............................... 246 246 246 246 246 324
(1) The Board of Directors will propose for shareholders’ approval at the Annual General Meeting
convening on May 7, 2013 that no dividend payment be made for 2012.
(2) For the years ended December 31, 2009, 2010 and 2011, cash and other liquid assets consist of
the following captions from our consolidated balance sheets: (1) bank and cash, (2) available-for-
sale investments, cash equivalents, (3) available-for-sale investments, liquid assets and
(4) investments at fair value through profit and loss, liquid assets. For the previous years, cash
and other liquid assets consist of the following captions from our consolidated balance sheets:
(1) bank and cash, (2) available-for-sale investments, cash equivalents, and (3) available-for-sale
investments, liquid assets.
(3) Net interest-bearing debt consists of borrowings due within one year and long-term interest-
bearing liabilities, less cash and other liquid assets.
9