Nokia 2012 Annual Report Download - page 242
Download and view the complete annual report
Please find page 242 of the 2012 Nokia annual report below. You can navigate through the pages in the report by either clicking on the pages listed below, or by using the keyword search tool below to find specific information within the annual report.-
 1
1 -
2
-
3
-
4
-
5
-
6
-
7
-
8
-
9
-
10
-
11
-
12
-
13
-
14
-
15
-
16
-
17
-
18
-
19
-
20
-
21
-
22
-
23
-
24
-
25
-
26
-
27
-
28
-
29
-
30
-
31
-
32
-
33
-
34
-
35
-
36
-
37
-
38
-
39
-
40
-
41
-
42
-
43
-
44
-
45
-
46
-
47
-
48
-
49
-
50
-
51
-
52
-
53
-
54
-
55
-
56
-
57
-
58
-
59
-
60
-
61
-
62
-
63
-
64
-
65
-
66
-
67
-
68
-
69
-
70
-
71
-
72
-
73
-
74
-
75
-
76
-
77
-
78
-
79
-
80
-
81
-
82
-
83
-
84
-
85
-
86
-
87
-
88
-
89
-
90
-
91
-
92
-
93
-
94
-
95
-
96
-
97
-
98
-
99
-
100
-
101
-
102
-
103
-
104
-
105
-
106
-
107
-
108
-
109
-
110
-
111
-
112
-
113
-
114
-
115
-
116
-
117
-
118
-
119
-
120
-
121
-
122
-
123
-
124
-
125
-
126
-
127
-
128
-
129
-
130
-
131
-
132
-
133
-
134
-
135
-
136
-
137
-
138
-
139
-
140
-
141
-
142
-
143
-
144
-
145
-
146
-
147
-
148
-
149
-
150
-
151
-
152
-
153
-
154
-
155
-
156
-
157
-
158
-
159
-
160
-
161
-
162
-
163
-
164
-
165
-
166
-
167
-
168
-
169
-
170
-
171
-
172
-
173
-
174
-
175
-
176
-
177
-
178
-
179
-
180
-
181
-
182
-
183
-
184
-
185
-
186
-
187
-
188
-
189
-
190
-
191
-
192
-
193
-
194
-
195
-
196
-
197
-
198
-
199
-
200
-
201
-
202
-
203
-
204
-
205
-
206
-
207
-
208
-
209
-
210
-
211
-
212
-
213
-
214
-
215
-
216
-
217
-
218
-
219
-
220
-
221
-
222
-
223
-
224
-
225
-
226
-
227
-
228
-
229
-
230
-
231
-
 232
232 -
 233
233 -
 234
234 -
 235
235 -
 236
236 -
 237
237 -
 238
238 -
 239
239 -
 240
240 -
 241
241 -
 242
242 -
 243
243 -
 244
244 -
 245
245 -
 246
246 -
 247
247 -
 248
248 -
 249
249 -
 250
250 -
 251
251 -
 252
252 -
253
-
254
-
255
-
256
-
257
-
258
-
259
-
260
-
261
-
262
-
263
-
264
-
265
-
266
-
267
-
268
-
269
-
270
-
271
-
272
-
273
-
274
-
275
-
276
-
277
-
278
-
279
-
280
-
281
-
282
-
283
-
284
 |
 |

12. Income taxes
2012 2011 2010
EURm EURm EURm
Income tax
Current tax .................................................... (641) (752) (798)
Deferred tax ................................................... (504) 462 355
Total ......................................................... (1 145) (290) (443)
Finnish entities ................................................. (724) (97) (126)
Other countries ................................................. (421) (193) (317)
Total ......................................................... (1 145) (290) (443)
The differences between income tax expense computed at statutory rate 24.5% in 2012 in Finland
(26% in 2011 and 2010) and income taxes recognized in the consolidated income statement is
reconciled as follows:
2012 2011 2010
EURm EURm EURm
Income tax expense (benefit) at statutory rate ............................ (648) (311) 464
Permanent differences ............................................... 75 (22) 4
Non tax deductible impairment of goodwill (Note 8) ........................ —283 —
Taxes for prior years ................................................. (50) (7) (48)
Taxes on foreign subsidiaries’ profits in excess of (lower than) income taxes at
statutory rates .................................................... 43 (73) (195)
Tax losses and temporary differences with no tax effect(1) .................. 1 675 280 221
Net increase (decrease) in tax contingencies ............................. 39 724
Change in income tax rates ........................................... 639 2
Taxes on undistributed earnings(2) ...................................... (4) 62 (31)
Other ............................................................. 932 2
Income tax expense ................................................. 1 145 290 443
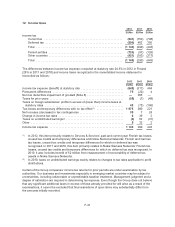
(1) In 2012, this item primarily relates to Devices & Services’ past and current year Finnish tax losses,
unused tax credits and temporary differences and Nokia Siemens Networks’ Finnish and German
tax losses, unused tax credits and temporary differences for which no deferred tax was
recognized. In 2011 and 2010, this item primarily relates to Nokia Siemens Networks’ Finnish tax
losses, unused tax credits and temporary differences for which no deferred tax was recognized. In
2010, it also includes benefit of 52 million from reassessment of recoverability of deferred tax
assets in Nokia Siemens Networks.
(2) In 2010, taxes on undistributed earnings mainly relates to changes to tax rates applicable to profit
distributions.
Certain of the Group companies’ income tax returns for prior periods are under examination by tax
authorities. Our business and investments especially in emerging market countries may be subject to
uncertainties, including unfavorable or unpredictable taxation treatment. Management judgment and a
degree of estimation are required in determining tax expense. Even though the Group does not believe
that any significant additional taxes in excess of those already provided for will arise as a result of the
examinations, it cannot be excluded that final resolutions of open items may substantially differ from
the amounts initially recorded.
F-41