Nokia 2012 Annual Report Download - page 117
Download and view the complete annual report
Please find page 117 of the 2012 Nokia annual report below. You can navigate through the pages in the report by either clicking on the pages listed below, or by using the keyword search tool below to find specific information within the annual report.-
 1
1 -
2
-
3
-
4
-
5
-
6
-
7
-
8
-
9
-
10
-
11
-
12
-
13
-
14
-
15
-
16
-
17
-
18
-
19
-
20
-
21
-
22
-
23
-
24
-
25
-
26
-
27
-
28
-
29
-
30
-
31
-
32
-
33
-
34
-
35
-
36
-
37
-
38
-
39
-
40
-
41
-
42
-
43
-
44
-
45
-
46
-
47
-
48
-
49
-
50
-
51
-
52
-
53
-
54
-
55
-
56
-
57
-
58
-
59
-
60
-
61
-
62
-
63
-
64
-
65
-
66
-
67
-
68
-
69
-
70
-
71
-
72
-
73
-
74
-
75
-
76
-
77
-
78
-
79
-
80
-
81
-
82
-
83
-
84
-
85
-
86
-
87
-
88
-
89
-
90
-
91
-
92
-
93
-
94
-
95
-
96
-
97
-
98
-
99
-
100
-
101
-
102
-
103
-
104
-
105
-
106
-
 107
107 -
 108
108 -
 109
109 -
 110
110 -
 111
111 -
 112
112 -
 113
113 -
 114
114 -
 115
115 -
 116
116 -
 117
117 -
 118
118 -
 119
119 -
 120
120 -
 121
121 -
 122
122 -
 123
123 -
 124
124 -
 125
125 -
 126
126 -
 127
127 -
128
-
129
-
130
-
131
-
132
-
133
-
134
-
135
-
136
-
137
-
138
-
139
-
140
-
141
-
142
-
143
-
144
-
145
-
146
-
147
-
148
-
149
-
150
-
151
-
152
-
153
-
154
-
155
-
156
-
157
-
158
-
159
-
160
-
161
-
162
-
163
-
164
-
165
-
166
-
167
-
168
-
169
-
170
-
171
-
172
-
173
-
174
-
175
-
176
-
177
-
178
-
179
-
180
-
181
-
182
-
183
-
184
-
185
-
186
-
187
-
188
-
189
-
190
-
191
-
192
-
193
-
194
-
195
-
196
-
197
-
198
-
199
-
200
-
201
-
202
-
203
-
204
-
205
-
206
-
207
-
208
-
209
-
210
-
211
-
212
-
213
-
214
-
215
-
216
-
217
-
218
-
219
-
220
-
221
-
222
-
223
-
224
-
225
-
226
-
227
-
228
-
229
-
230
-
231
-
232
-
233
-
234
-
235
-
236
-
237
-
238
-
239
-
240
-
241
-
242
-
243
-
244
-
245
-
246
-
247
-
248
-
249
-
250
-
251
-
252
-
253
-
254
-
255
-
256
-
257
-
258
-
259
-
260
-
261
-
262
-
263
-
264
-
265
-
266
-
267
-
268
-
269
-
270
-
271
-
272
-
273
-
274
-
275
-
276
-
277
-
278
-
279
-
280
-
281
-
282
-
283
-
284
 |
 |

Net Sales
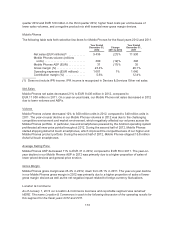
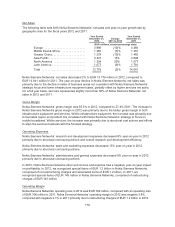
The following table sets forth Nokia Siemens Networks’ net sales and year-on-year growth rate by
geographic area for the fiscal years 2012 and 2011.
Year Ended
December 31,
2012
Change
2011 to 2012
Year Ended
December 31,
2011
(EUR millions, except percentage data)
Europe ........................... 3896 (13)% 4 469
Middle East & Africa ................ 1287 (7)% 1 391
Greater China ...................... 1278 (13)% 1 465
Asia-Pacific ........................ 4347 13% 3848
North America ..................... 1294 20% 1077
Latin America ...................... 1677 (6)% 1 791
Total ............................. 13779 (2)% 14 041
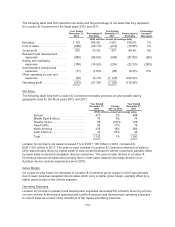
Nokia Siemens Networks’ net sales decreased 2% to EUR 13 779 million in 2012, compared to
EUR 14 041 million in 2011. The year-on-year decline in Nokia Siemens Networks’ net sales was
primarily due to the decline in sales of business areas not consistent with Nokia Siemens Networks’
strategic focus and lower infrastructure equipment sales, partially offset by higher services net sales.
On a full year basis, services represented slightly more than 50% of Nokia Siemens Networks’ net
sales in 2012 and 2011.
Gross Margin
Nokia Siemens Networks’ gross margin was 30.3% in 2012, compared to 27.4% 2011. The increase in
Nokia Siemens Networks gross margin in 2012 was primarily due to the better gross margin in both
infrastructure equipment and services. Within infrastructure equipment, the increase was primarily due
to favorable region and product mix consistent with Nokia Siemens Networks’ strategy to focus on
mobile broadband. Within services, the increase was primarily due to structural cost actions and efforts
to align the services business with the focused strategy.
Operating Expenses
Nokia Siemens Networks’ research and development expenses decreased 6% year-on-year in 2012
primarily due to structural cost saving actions and overall research and development efficiency.
Nokia Siemens Networks’ sales and marketing expenses decreased 13% year-on-year in 2012
primarily due to structural cost saving actions.
Nokia Siemens Networks’ administrative and general expenses decreased 8% year-on-year in 2012
primarily due to structural cost saving actions.
In 2012, Nokia Siemens Networks other and income and expense had a negative year-on-year impact
on profitability. In 2012, we recognized special items of EUR 1.2 billion in Nokia Siemens Networks,
comprised of net restructuring charges and associated items of EUR 1.2 billion. In 2011, we
recognized special items of EUR 145 million in Nokia Siemens Networks, comprised of restructuring
charges of EUR 145 million.
Operating Margin
Nokia Siemens Networks’ operating loss in 2012 was EUR 799 million, compared with an operating loss
of EUR 300 million in 2011. Nokia Siemens Networks’ operating margin in 2012 was negative 5.8%,
compared with negative 2.1% in 2011 primarily due to restructuring charges of EUR 1.2 billion in 2012.
116