Nokia 2012 Annual Report Download - page 120
Download and view the complete annual report
Please find page 120 of the 2012 Nokia annual report below. You can navigate through the pages in the report by either clicking on the pages listed below, or by using the keyword search tool below to find specific information within the annual report.-
 1
1 -
2
-
3
-
4
-
5
-
6
-
7
-
8
-
9
-
10
-
11
-
12
-
13
-
14
-
15
-
16
-
17
-
18
-
19
-
20
-
21
-
22
-
23
-
24
-
25
-
26
-
27
-
28
-
29
-
30
-
31
-
32
-
33
-
34
-
35
-
36
-
37
-
38
-
39
-
40
-
41
-
42
-
43
-
44
-
45
-
46
-
47
-
48
-
49
-
50
-
51
-
52
-
53
-
54
-
55
-
56
-
57
-
58
-
59
-
60
-
61
-
62
-
63
-
64
-
65
-
66
-
67
-
68
-
69
-
70
-
71
-
72
-
73
-
74
-
75
-
76
-
77
-
78
-
79
-
80
-
81
-
82
-
83
-
84
-
85
-
86
-
87
-
88
-
89
-
90
-
91
-
92
-
93
-
94
-
95
-
96
-
97
-
98
-
99
-
100
-
101
-
102
-
103
-
104
-
105
-
106
-
107
-
108
-
109
-
 110
110 -
 111
111 -
 112
112 -
 113
113 -
 114
114 -
 115
115 -
 116
116 -
 117
117 -
 118
118 -
 119
119 -
 120
120 -
 121
121 -
 122
122 -
 123
123 -
 124
124 -
 125
125 -
 126
126 -
 127
127 -
 128
128 -
 129
129 -
 130
130 -
131
-
132
-
133
-
134
-
135
-
136
-
137
-
138
-
139
-
140
-
141
-
142
-
143
-
144
-
145
-
146
-
147
-
148
-
149
-
150
-
151
-
152
-
153
-
154
-
155
-
156
-
157
-
158
-
159
-
160
-
161
-
162
-
163
-
164
-
165
-
166
-
167
-
168
-
169
-
170
-
171
-
172
-
173
-
174
-
175
-
176
-
177
-
178
-
179
-
180
-
181
-
182
-
183
-
184
-
185
-
186
-
187
-
188
-
189
-
190
-
191
-
192
-
193
-
194
-
195
-
196
-
197
-
198
-
199
-
200
-
201
-
202
-
203
-
204
-
205
-
206
-
207
-
208
-
209
-
210
-
211
-
212
-
213
-
214
-
215
-
216
-
217
-
218
-
219
-
220
-
221
-
222
-
223
-
224
-
225
-
226
-
227
-
228
-
229
-
230
-
231
-
232
-
233
-
234
-
235
-
236
-
237
-
238
-
239
-
240
-
241
-
242
-
243
-
244
-
245
-
246
-
247
-
248
-
249
-
250
-
251
-
252
-
253
-
254
-
255
-
256
-
257
-
258
-
259
-
260
-
261
-
262
-
263
-
264
-
265
-
266
-
267
-
268
-
269
-
270
-
271
-
272
-
273
-
274
-
275
-
276
-
277
-
278
-
279
-
280
-
281
-
282
-
283
-
284
 |
 |

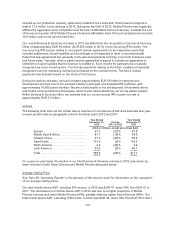
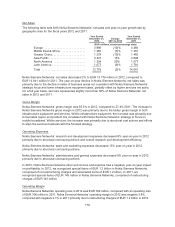
2.4% in 2010. The increase in administrative and general expenses as a percentage of net sales
reflected the decrease in net sales in 2011. Administrative and general expenses included purchase
price accounting items of EUR 1 million in 2011, which was unchanged compared to 2010.
In 2011, other income and expenses included restructuring charges of EUR 626 million, impairment of
assets of EUR 90 million, consideration related to the Accenture transaction of EUR 251 million,
impairment of shares in an associated company of EUR 41 million and a benefit from a cartel claim
settlement of EUR 49 million in 2011. In 2010, other income and expenses included restructuring
charges of EUR 401 million, a prior year-related refund of customs duties of EUR 61 million, a gain on
sale of assets and businesses of EUR 29 million and a gain on sale of the wireless modem business of
EUR 147 million.
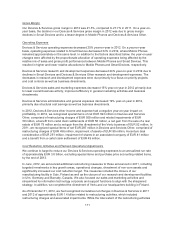
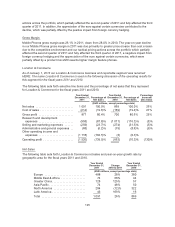
Operating Margin
Our 2011 operating loss was EUR 1 073 million, compared with an operating profit of
EUR 2 070 million in 2010. The decreased operating profit resulted primarily from an impairment of
goodwill of EUR 1.1 billion in our Location & Commerce business, a decrease in the operating profit in
our Devices & Services business, which was partially offset by a decrease in the operating loss in
Nokia Siemens Networks. Our 2011 operating margin was negative 2.8%, compared to 4.9% in 2010.
Our operating profit in 2011 included purchase price accounting items and other special items of net
negative EUR 2 898 million compared to net negative EUR 1 134 million in 2010.
Corporate Common
Corporate Common Functions’ expenses totaled EUR 131 million in 2011, compared to
EUR 113 million in 2010.
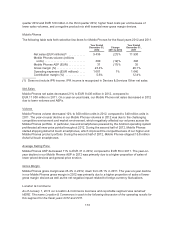
Net Financial Income and Expenses
Financial income and expenses, net, was an expense of EUR 102 million in 2011 compared to an
expense of EUR 285 million in 2010. The lower net expense in 2011 was primarily driven by lower net
costs related to hedging our cash balances and favorable fluctuations in certain foreign exchange
rates. Nokia expects financial income and expenses, net, in 2012 to be an expense of approximately
EUR 300 million primarily due to higher expected net costs related to hedging our cash balances, as
well as higher costs related to Nokia Siemens Networks’ financing.
Our net debt to equity ratio was negative 40% at December 31, 2011, compared with a net debt to
equity ratio of negative 43% at December 31, 2010. See Item 5B. “Liquidity and Capital Resources”
below.
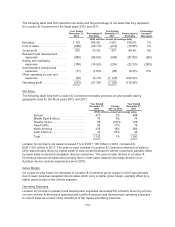
Profit Before Taxes
Loss before tax was EUR 1 198 million in 2011, compared to profit of EUR 1 786 million in 2010. Taxes
amounted to EUR 290 million in 2011 and EUR 443 million in 2010. The effective tax rate decreased to
negative 24.2% in 2011, compared with 24.8% in 2010. In 2011, our taxes continued to be unfavorably
affected by Nokia Siemens Networks taxes as no tax benefits are recognized for certain Nokia
Siemens Networks deferred tax items due to uncertainty of utilization of these items.
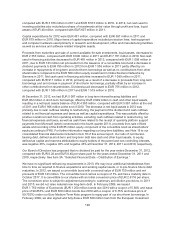
Non-controlling interests
Loss attributable to non-controlling interests totaled EUR 324 million in 2011, compared with loss
attributable to non-controlling interests of EUR 507 million in 2010. This change was primarily due to a
decrease in Nokia Siemens Networks’ losses.
119