Nokia 2012 Annual Report Download - page 101
Download and view the complete annual report
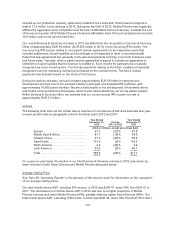
Please find page 101 of the 2012 Nokia annual report below. You can navigate through the pages in the report by either clicking on the pages listed below, or by using the keyword search tool below to find specific information within the annual report.debt, customer concentrations, customer creditworthiness, current economic trends and changes in
our customer payment terms when evaluating the adequacy of the allowance for doubtful accounts.
Based on these estimates and assumptions the allowance for doubtful accounts was EUR 248 million
at the end of 2012 (EUR 284 million at the end of 2011).
Inventory-related Allowances
We periodically review our inventory for excess, obsolescence and declines in market value below cost
and record an allowance against the inventory balance for any such declines. These reviews require
management to estimate future demand for our products. Possible changes in these estimates could
result in revisions to the valuation of inventory in future periods. Based on these estimates and
assumptions, the allowance for excess and obsolete inventory was EUR 471 million at the end of 2012
(EUR 457 million at the end of 2011). The financial impact of the assumptions regarding this allowance
affects mainly the cost of sales of the Devices & Services and Nokia Siemens Networks businesses.
During 2012 the Group also recognized an expense of EUR 55 million (EUR 0 in 2011) within
Devices & Services’ cost of sales to write-down the inventories to net realizable value.
Warranty Provisions
We provide for the estimated cost of product warranties at the time revenue is recognized. Our
products are covered by product warranty plans of varying periods, depending on local practices and
regulations. While we engage in extensive product quality programs and processes, including actively
monitoring and evaluating the quality of our component suppliers, our warranty obligations are affected
by actual product failure rates (field failure rates) and by material usage and service delivery costs
incurred in correcting a product failure. Our warranty provision is established based upon our best
estimates of the amounts necessary to settle future and existing claims on products sold as of the
balance sheet date. As we continuously introduce new products which incorporate complex
technology, and as local laws, regulations and practices may change, it will be increasingly difficult to
anticipate our failure rates, the length of warranty periods and repair costs. While we believe that our
warranty provisions are adequate and that the judgments applied are appropriate, the ultimate cost of
product warranty could differ materially from our estimates. When the actual cost of quality of our
products is lower than we originally anticipated, we release an appropriate proportion of the provision,
and if the cost of quality is higher than anticipated, we increase the provision. Based on these
estimates and assumptions the warranty provision was EUR 407 million at the end of 2012
(EUR 688 million at the end of 2011). The financial impact of the assumptions regarding this provision
mainly affects the cost of sales of our Devices & Services business.
Provision for Intellectual Property Rights, or IPR, Infringements
We provide for the estimated past costs related to alleged asserted IPR infringements based on the
probable outcome of each potential future settlement.
Our products include increasingly complex technologies involving numerous patented and other
proprietary technologies. Although we proactively try to ensure that we are aware of any patents and
other IPR related to our products under development and thereby avoid inadvertent infringement of
proprietary technologies, the nature of our business is such that patent and other IPR infringements
may and do occur. We identify potential IPR infringements through contact with parties claiming
infringement of their patented or otherwise exclusive technology, or through our own monitoring of
developments in patent and other IPR cases involving our competitors.
We estimate the outcome of all potential IPR infringements made known to us through assertion by
third parties, or through our own monitoring of patent- and other IPR-related cases in the relevant legal
100


