Nokia 2012 Annual Report Download - page 124
Download and view the complete annual report
Please find page 124 of the 2012 Nokia annual report below. You can navigate through the pages in the report by either clicking on the pages listed below, or by using the keyword search tool below to find specific information within the annual report.-
 1
1 -
2
-
3
-
4
-
5
-
6
-
7
-
8
-
9
-
10
-
11
-
12
-
13
-
14
-
15
-
16
-
17
-
18
-
19
-
20
-
21
-
22
-
23
-
24
-
25
-
26
-
27
-
28
-
29
-
30
-
31
-
32
-
33
-
34
-
35
-
36
-
37
-
38
-
39
-
40
-
41
-
42
-
43
-
44
-
45
-
46
-
47
-
48
-
49
-
50
-
51
-
52
-
53
-
54
-
55
-
56
-
57
-
58
-
59
-
60
-
61
-
62
-
63
-
64
-
65
-
66
-
67
-
68
-
69
-
70
-
71
-
72
-
73
-
74
-
75
-
76
-
77
-
78
-
79
-
80
-
81
-
82
-
83
-
84
-
85
-
86
-
87
-
88
-
89
-
90
-
91
-
92
-
93
-
94
-
95
-
96
-
97
-
98
-
99
-
100
-
101
-
102
-
103
-
104
-
105
-
106
-
107
-
108
-
109
-
110
-
111
-
112
-
113
-
 114
114 -
 115
115 -
 116
116 -
 117
117 -
 118
118 -
 119
119 -
 120
120 -
 121
121 -
 122
122 -
 123
123 -
 124
124 -
 125
125 -
 126
126 -
 127
127 -
 128
128 -
 129
129 -
 130
130 -
 131
131 -
 132
132 -
 133
133 -
 134
134 -
135
-
136
-
137
-
138
-
139
-
140
-
141
-
142
-
143
-
144
-
145
-
146
-
147
-
148
-
149
-
150
-
151
-
152
-
153
-
154
-
155
-
156
-
157
-
158
-
159
-
160
-
161
-
162
-
163
-
164
-
165
-
166
-
167
-
168
-
169
-
170
-
171
-
172
-
173
-
174
-
175
-
176
-
177
-
178
-
179
-
180
-
181
-
182
-
183
-
184
-
185
-
186
-
187
-
188
-
189
-
190
-
191
-
192
-
193
-
194
-
195
-
196
-
197
-
198
-
199
-
200
-
201
-
202
-
203
-
204
-
205
-
206
-
207
-
208
-
209
-
210
-
211
-
212
-
213
-
214
-
215
-
216
-
217
-
218
-
219
-
220
-
221
-
222
-
223
-
224
-
225
-
226
-
227
-
228
-
229
-
230
-
231
-
232
-
233
-
234
-
235
-
236
-
237
-
238
-
239
-
240
-
241
-
242
-
243
-
244
-
245
-
246
-
247
-
248
-
249
-
250
-
251
-
252
-
253
-
254
-
255
-
256
-
257
-
258
-
259
-
260
-
261
-
262
-
263
-
264
-
265
-
266
-
267
-
268
-
269
-
270
-
271
-
272
-
273
-
274
-
275
-
276
-
277
-
278
-
279
-
280
-
281
-
282
-
283
-
284
 |
 |

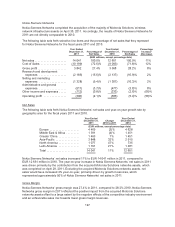
12.2% in 2010. The year-on-year decrease in operating margin in 2010 was driven primarily by the
lower net sales and gross margin compared to 2010 in both Smart Devices and Mobile Phones as well
as higher restructuring charges and Accenture transaction related consideration.
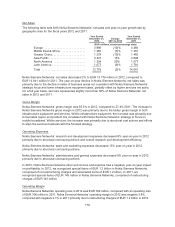
Smart Devices
The following table sets forth selective line items for Smart Devices for the fiscal years 2011 and 2010.
Year Ended
December 31,
2011
Change
2010 to 2011
Year Ended
December 31,
2010
Net sales (EUR millions)(1) .......... 10820 (27)% 14 874
Smart Devices volume (millions
units) .......................... 77.3 (25)% 103.6
Smart Devices ASP (EUR) .......... 140 (3)% 144
Gross margin (%) ................. 23.7% 30.8%
Operating expenses (EUR millions) . . . 2 974 (12)% 3 392
Contribution margin (%) ............ (3.8)% 9.3%
(1) Does not include IPR income. IPR income is recognized in Devices & Services Other net sales.
Net Sales
Smart Devices net sales decreased 27% to EUR 10 820 million in 2011, compared to
EUR 14 874 million in 2010. The year-on-year decline in our Smart Devices net sales in 2011 was
primarily due to significantly lower volumes and, to a lesser extent, lower ASPs.
Volume
Smart Devices volume decreased 25% to 77.3 million units in 2011, compared to 103.6 million units in
2010. The year-on-year decrease in our Smart Device volumes in 2011 was driven by the strong
momentum of competing smartphone platforms relative to our higher priced Symbian devices,
particularly in Europe and Asia Pacific, as well as pricing tactics by certain of our competitors. During
the second quarter of 2011, our Smart Device volumes were also negatively affected by distributors
and operators purchasing fewer of our smartphones as they reduced their inventories of those devices,
which were slightly above normal levels at the end of the first quarter of 2011, particularly in China.
During the second half of 2011, our Symbian competitiveness continued to be challenged across the
portfolio driving the significant year-on-year volume decline.
Average Selling Price
Smart Devices ASP decreased 3% to EUR 140 in 2011, compared to EUR 144 in 2010. The year-on-
year decline in our Smart Devices ASP in 2011 was driven primarily by price actions due to the
competitive environment and the negative impact from foreign currency hedging, partially offset by a
positive mix shift towards higher priced smartphones, such as the Nokia N8, Nokia N9 and Lumia
devices, and the lower deferral of revenue related to services sold in combination with our devices,
particularly in the second half of 2011.
Although Smart Devices ASP declined progressively during the first three quarters of 2011, Smart
Devices ASP increased sequentially in the fourth quarter of 2011, supported by sales of the higher
priced Nokia N9 and Nokia Lumia devices.
Gross Margin
Smart Devices gross margin was 23.7% in 2011, down from 30.8% in 2010. The year-on-year decline
in our Smart Devices gross margin in 2011 was driven primarily by greater price erosion than cost
123