Nokia 2012 Annual Report Download - page 104
Download and view the complete annual report
Please find page 104 of the 2012 Nokia annual report below. You can navigate through the pages in the report by either clicking on the pages listed below, or by using the keyword search tool below to find specific information within the annual report.-
 1
1 -
2
-
3
-
4
-
5
-
6
-
7
-
8
-
9
-
10
-
11
-
12
-
13
-
14
-
15
-
16
-
17
-
18
-
19
-
20
-
21
-
22
-
23
-
24
-
25
-
26
-
27
-
28
-
29
-
30
-
31
-
32
-
33
-
34
-
35
-
36
-
37
-
38
-
39
-
40
-
41
-
42
-
43
-
44
-
45
-
46
-
47
-
48
-
49
-
50
-
51
-
52
-
53
-
54
-
55
-
56
-
57
-
58
-
59
-
60
-
61
-
62
-
63
-
64
-
65
-
66
-
67
-
68
-
69
-
70
-
71
-
72
-
73
-
74
-
75
-
76
-
77
-
78
-
79
-
80
-
81
-
82
-
83
-
84
-
85
-
86
-
87
-
88
-
89
-
90
-
91
-
92
-
93
-
 94
94 -
 95
95 -
 96
96 -
 97
97 -
 98
98 -
 99
99 -
 100
100 -
 101
101 -
 102
102 -
 103
103 -
 104
104 -
 105
105 -
 106
106 -
 107
107 -
 108
108 -
 109
109 -
 110
110 -
 111
111 -
 112
112 -
 113
113 -
 114
114 -
115
-
116
-
117
-
118
-
119
-
120
-
121
-
122
-
123
-
124
-
125
-
126
-
127
-
128
-
129
-
130
-
131
-
132
-
133
-
134
-
135
-
136
-
137
-
138
-
139
-
140
-
141
-
142
-
143
-
144
-
145
-
146
-
147
-
148
-
149
-
150
-
151
-
152
-
153
-
154
-
155
-
156
-
157
-
158
-
159
-
160
-
161
-
162
-
163
-
164
-
165
-
166
-
167
-
168
-
169
-
170
-
171
-
172
-
173
-
174
-
175
-
176
-
177
-
178
-
179
-
180
-
181
-
182
-
183
-
184
-
185
-
186
-
187
-
188
-
189
-
190
-
191
-
192
-
193
-
194
-
195
-
196
-
197
-
198
-
199
-
200
-
201
-
202
-
203
-
204
-
205
-
206
-
207
-
208
-
209
-
210
-
211
-
212
-
213
-
214
-
215
-
216
-
217
-
218
-
219
-
220
-
221
-
222
-
223
-
224
-
225
-
226
-
227
-
228
-
229
-
230
-
231
-
232
-
233
-
234
-
235
-
236
-
237
-
238
-
239
-
240
-
241
-
242
-
243
-
244
-
245
-
246
-
247
-
248
-
249
-
250
-
251
-
252
-
253
-
254
-
255
-
256
-
257
-
258
-
259
-
260
-
261
-
262
-
263
-
264
-
265
-
266
-
267
-
268
-
269
-
270
-
271
-
272
-
273
-
274
-
275
-
276
-
277
-
278
-
279
-
280
-
281
-
282
-
283
-
284
 |
 |

exceed long-term average growth rates for the industry and economies in which the CGU operates. All
cash flow projections are consistent with external sources of information, wherever available.
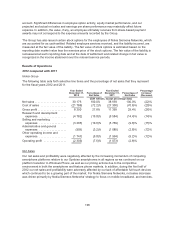
The key assumptions applied in the impairment testing for each CGU in the annual goodwill
impairment testing for each year indicated are presented in the table below:
Cash generating units
Smart
Devices
%
Mobile
Phones
%
Location &
Commerce
%
Nokia Siemens
Networks
%
2012 2011 2012 2011 2012 2011 2012 2011
Terminal growth rate ........................... 2.3 1.9 (2.3) 1.5 1.7 3.1 0.7 1.0
Post-tax discount rate .......................... 10.5 9.0 10.5 9.0 9.9 9.7 10.3 10.4
Pre-tax discount rate ........................... 12.8 12.2 15.5 13.1 12.8 13.1 14.2 13.8
Both value in use of Smart Devices CGU and Mobile Phones CGU and fair value less costs to sell for
Location & Commerce CGU and Nokia Siemens Networks CGU are determined on a pre-tax value
basis using pre-tax valuation assumptions including pre-tax cash flows and pre-tax discount rate. As
market-based rates of return for the Group’s CGUs are available only on a post-tax basis, the pre-tax
discount rates are derived by adjusting the post-tax discount rates to reflect the specific amount and
timing of future tax cash flows. The discount rates applied in the impairment testing for each CGU have
been determined independently of capital structure reflecting current assessments of the time value of
money and relevant market risk premiums. Risk premiums included in the determination of the
discount rate reflect risks and uncertainties for which the future cash flow estimates have not been
adjusted.
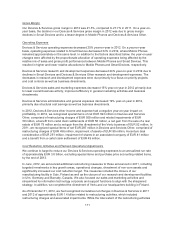
The recoverable amount of the Location & Commerce CGU exceeds its carrying amount by a small
margin in the fourth quarter 2012. The related valuation is deemed most sensitive to the changes in
both discount and long-term growth rates. A discount rate increase in excess of 0.5 percentage point or
long-term growth decline in excess of 1 percentage point would result in impairment loss in the
Location & Commerce CGU. Management’s estimates of the overall automotive volumes and market
share, customer adoption of the new location-based platform and related service offerings, projected
device sales volumes and fair value of the services sold within the Group as well as continued focus on
cost efficiency are the main drivers for the Location & Commerce net cash flow projections. The
Group’s cash flow forecasts reflect the current strategic views that license fee based models will
remain important in both near and long term. Management expects that license fee based models
which are augmented with software and services and monetized via license fees, transactions fees and
advertising, will grow in the future as more customers demand complete, end-to-end location solutions.
Actual short and long-term performance could vary from management’s forecasts and impact future
estimates of recoverable value. Since the recoverable amount exceeds the carrying amount only by a
small margin, any material adverse changes such as market deterioration or changes in the
competitive landscape could impact management’s estimates of the main drivers and result in
impairment loss.
A charge to operating profit of EUR 1 090 million was recorded for the impairment of goodwill in our
Location & Commerce business in the fourth quarter 2011. The impairment loss was allocated in its
entirety to the carrying amount of goodwill in the balance sheet of the Location & Commerce CGU.
This impairment loss is presented as impairment of goodwill in the consolidated income statement. As
a result of the impairment loss, the amount of goodwill allocated to the Location & Commerce CGU
was reduced to EUR 3 274 million at December 31, 2011.
The impairment charge was the result of an evaluation of the projected financial performance and net
cash flows of the Location & Commerce CGU. The main drivers for management’s net cash flow
projections included license fees related to digital map data, fair value of the services sold within the
103