Nokia 2012 Annual Report Download - page 282
Download and view the complete annual report
Please find page 282 of the 2012 Nokia annual report below. You can navigate through the pages in the report by either clicking on the pages listed below, or by using the keyword search tool below to find specific information within the annual report.-
 1
1 -
2
-
3
-
4
-
5
-
6
-
7
-
8
-
9
-
10
-
11
-
12
-
13
-
14
-
15
-
16
-
17
-
18
-
19
-
20
-
21
-
22
-
23
-
24
-
25
-
26
-
27
-
28
-
29
-
30
-
31
-
32
-
33
-
34
-
35
-
36
-
37
-
38
-
39
-
40
-
41
-
42
-
43
-
44
-
45
-
46
-
47
-
48
-
49
-
50
-
51
-
52
-
53
-
54
-
55
-
56
-
57
-
58
-
59
-
60
-
61
-
62
-
63
-
64
-
65
-
66
-
67
-
68
-
69
-
70
-
71
-
72
-
73
-
74
-
75
-
76
-
77
-
78
-
79
-
80
-
81
-
82
-
83
-
84
-
85
-
86
-
87
-
88
-
89
-
90
-
91
-
92
-
93
-
94
-
95
-
96
-
97
-
98
-
99
-
100
-
101
-
102
-
103
-
104
-
105
-
106
-
107
-
108
-
109
-
110
-
111
-
112
-
113
-
114
-
115
-
116
-
117
-
118
-
119
-
120
-
121
-
122
-
123
-
124
-
125
-
126
-
127
-
128
-
129
-
130
-
131
-
132
-
133
-
134
-
135
-
136
-
137
-
138
-
139
-
140
-
141
-
142
-
143
-
144
-
145
-
146
-
147
-
148
-
149
-
150
-
151
-
152
-
153
-
154
-
155
-
156
-
157
-
158
-
159
-
160
-
161
-
162
-
163
-
164
-
165
-
166
-
167
-
168
-
169
-
170
-
171
-
172
-
173
-
174
-
175
-
176
-
177
-
178
-
179
-
180
-
181
-
182
-
183
-
184
-
185
-
186
-
187
-
188
-
189
-
190
-
191
-
192
-
193
-
194
-
195
-
196
-
197
-
198
-
199
-
200
-
201
-
202
-
203
-
204
-
205
-
206
-
207
-
208
-
209
-
210
-
211
-
212
-
213
-
214
-
215
-
216
-
217
-
218
-
219
-
220
-
221
-
222
-
223
-
224
-
225
-
226
-
227
-
228
-
229
-
230
-
231
-
232
-
233
-
234
-
235
-
236
-
237
-
238
-
239
-
240
-
241
-
242
-
243
-
244
-
245
-
246
-
247
-
248
-
249
-
250
-
251
-
252
-
253
-
254
-
255
-
256
-
257
-
258
-
259
-
260
-
261
-
262
-
263
-
264
-
265
-
266
-
267
-
268
-
269
-
270
-
271
-
 272
272 -
 273
273 -
 274
274 -
 275
275 -
 276
276 -
 277
277 -
 278
278 -
 279
279 -
 280
280 -
 281
281 -
 282
282 -
 283
283 -
 284
284
 |
 |

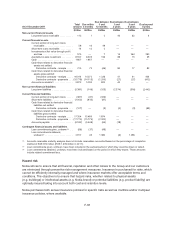
At 31 December 2011
Total
amount
Due within
3 months
Due between
3 and
12 months
Due between
1 and
3 years
Due between
3 and
5 years
Due beyond
5 years
EURm EURm EURm EURm EURm EURm
Non-current financial assets
Long-term loans receivable ........... 112 1 2 43 62 4
Current financial assets
Current portion of long-term loans
receivable ....................... 59 10 49 — — —
Short-term loans receivable .......... 14 12 2 — — —
Investments at fair value through profit
and loss ......................... 575 — 7 14 264 290
Available-for-sale investment ......... 8557 8305 133 69 15 35
Cash ............................. 1957 1957 — — — —
Cash flows related to derivative financial
assets net settled:
Derivative contracts - receipts ..... 215 72 (46) 90 17 82
Cash flows related to derivative financial
assets gross settled:
Derivative contracts - receipts ..... 16014 14272 1226 41 41 434
Derivative contracts - payments . . . (15 779) (14 113) (1 200) (27) (27) (412)
Accounts receivable(1) ............... 5872 5030 802 40 — —
Non-current financial liabilities
Long-term liabilities ................. (5391) (106) (153) (2 374) (316) (2 442)
Current financial liabilities
Current portion of long-term loans ..... (387) (61) (326) — — —
Short-term liabilities ................. (1002) (915) (87) — — —
Cash flows related to derivative financial
liabilities net settled:
Derivative contracts - payments . . . (107) — (3) (2) (3) (99)
Cash flows related to derivative financial
liabilities gross settled:
Derivative contracts - receipts ..... 17354 15480 1874 — — —
Derivative contracts - payments . . . (17 775) (15 775) (2 000) — — —
Accounts payable .................. (5532) (5 449) (65) (18) — —
Contingent financial assets and liabilities
Loan commitments given, undrawn(2) . . (86) (37) (49) — — —
Loan commitments obtained,
undrawn(3) ....................... 2917 45 1382 (6) 1496 —
(1) Accounts receivable maturity analysis does not include receivables accounted based on the percentage of completion
method of EUR 972 million (EUR 1 309 million in 2011).
(2) Loan commitments given, undrawn, have been included in the earliest period in which they could be drawn or called.
(3) Loan commitments obtained, undrawn, have been included based on the period in which they expire. These amounts
include related commitment fees.
Hazard risk
Nokia strives to ensure that all financial, reputation and other losses to the Group and our customers
are minimized through preventive risk management measures. Insurance is purchased for risks, which
cannot be efficiently internally managed and where insurance markets offer acceptable terms and
conditions. The objective is to ensure that hazard risks, whether related to physical assets
(e.g. buildings) or intellectual assets (e.g. Nokia brand) or potential liabilities (e.g. product liability) are
optimally insured taking into account both cost and retention levels.
Nokia purchases both annual insurance policies for specific risks as well as multiline and/or multiyear
insurance policies, where available.
F-81