Nokia 2012 Annual Report Download - page 249
Download and view the complete annual report
Please find page 249 of the 2012 Nokia annual report below. You can navigate through the pages in the report by either clicking on the pages listed below, or by using the keyword search tool below to find specific information within the annual report.-
 1
1 -
2
-
3
-
4
-
5
-
6
-
7
-
8
-
9
-
10
-
11
-
12
-
13
-
14
-
15
-
16
-
17
-
18
-
19
-
20
-
21
-
22
-
23
-
24
-
25
-
26
-
27
-
28
-
29
-
30
-
31
-
32
-
33
-
34
-
35
-
36
-
37
-
38
-
39
-
40
-
41
-
42
-
43
-
44
-
45
-
46
-
47
-
48
-
49
-
50
-
51
-
52
-
53
-
54
-
55
-
56
-
57
-
58
-
59
-
60
-
61
-
62
-
63
-
64
-
65
-
66
-
67
-
68
-
69
-
70
-
71
-
72
-
73
-
74
-
75
-
76
-
77
-
78
-
79
-
80
-
81
-
82
-
83
-
84
-
85
-
86
-
87
-
88
-
89
-
90
-
91
-
92
-
93
-
94
-
95
-
96
-
97
-
98
-
99
-
100
-
101
-
102
-
103
-
104
-
105
-
106
-
107
-
108
-
109
-
110
-
111
-
112
-
113
-
114
-
115
-
116
-
117
-
118
-
119
-
120
-
121
-
122
-
123
-
124
-
125
-
126
-
127
-
128
-
129
-
130
-
131
-
132
-
133
-
134
-
135
-
136
-
137
-
138
-
139
-
140
-
141
-
142
-
143
-
144
-
145
-
146
-
147
-
148
-
149
-
150
-
151
-
152
-
153
-
154
-
155
-
156
-
157
-
158
-
159
-
160
-
161
-
162
-
163
-
164
-
165
-
166
-
167
-
168
-
169
-
170
-
171
-
172
-
173
-
174
-
175
-
176
-
177
-
178
-
179
-
180
-
181
-
182
-
183
-
184
-
185
-
186
-
187
-
188
-
189
-
190
-
191
-
192
-
193
-
194
-
195
-
196
-
197
-
198
-
199
-
200
-
201
-
202
-
203
-
204
-
205
-
206
-
207
-
208
-
209
-
210
-
211
-
212
-
213
-
214
-
215
-
216
-
217
-
218
-
219
-
220
-
221
-
222
-
223
-
224
-
225
-
226
-
227
-
228
-
229
-
230
-
231
-
232
-
233
-
234
-
235
-
236
-
237
-
238
-
 239
239 -
 240
240 -
 241
241 -
 242
242 -
 243
243 -
 244
244 -
 245
245 -
 246
246 -
 247
247 -
 248
248 -
 249
249 -
 250
250 -
 251
251 -
 252
252 -
 253
253 -
 254
254 -
 255
255 -
 256
256 -
 257
257 -
 258
258 -
 259
259 -
260
-
261
-
262
-
263
-
264
-
265
-
266
-
267
-
268
-
269
-
270
-
271
-
272
-
273
-
274
-
275
-
276
-
277
-
278
-
279
-
280
-
281
-
282
-
283
-
284
 |
 |

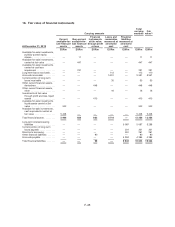
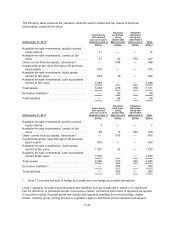
regularly occurring market transactions on an arm’s length basis. This category includes listed bonds
and other securities, listed shares and exchange traded derivatives.
Level 2 category includes financial assets and liabilities measured using a valuation technique based
on assumptions that are supported by prices from observable current market transactions. These
include assets and liabilities for which pricing is obtained via pricing services, but where prices have
not been determined in an active market, financial assets with fair values based on broker quotes and
assets that are valued using the Group’s own valuation models whereby the material assumptions are
market observable. The majority of the Group’s over-the-counter derivatives and certain other
instruments not traded in active markets fall within this category.
Level 3 category includes financial assets and liabilities measured using valuation techniques based on
non market observable inputs. This means that fair values are determined in whole or in part using a
valuation model based on assumptions that are neither supported by prices from observable current
market transactions in the same instrument nor are they based on available market data. However, the
fair value measurement objective remains the same, that is, to estimate an exit price from the
perspective of the Group. The main asset classes in this category are unlisted equity investments as
well as unlisted funds.
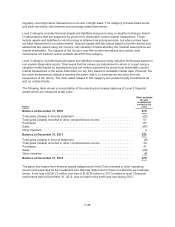
The following table shows a reconciliation of the opening and closing balances of Level 3 financial
assets which are measured at fair value:
EURm
Other available-
for-sale
investments
carried at fair
value
Balance at December 31, 2010 279
Total gains (losses) in income statement ....................................... (22)
Total gains (losses) recorded in other comprehensive income ..................... 51
Purchases ............................................................... 81
Sales .................................................................... (47)
Other transfers ............................................................ 4
Balance at December 31, 2011 346
Total gains (losses) in income statement ....................................... (8)
Total gains (losses) recorded in other comprehensive income ..................... 34
Purchases ............................................................... 41
Sales .................................................................... (35)
Other transfers ............................................................ (8)
Balance at December 31, 2012 ............................................. 370
The gains and losses from financial assets categorized in level 3 are included in other operating
income and expenses as the investment and disposal objectives for these investments are business
driven. A net loss of EUR 23 million (net loss of EUR 30 million in 2011) related to level 3 financial
instruments held at December 31, 2012, was included in the profit and loss during 2012.
F-48