Nokia 2012 Annual Report Download - page 134
Download and view the complete annual report
Please find page 134 of the 2012 Nokia annual report below. You can navigate through the pages in the report by either clicking on the pages listed below, or by using the keyword search tool below to find specific information within the annual report.-
 1
1 -
2
-
3
-
4
-
5
-
6
-
7
-
8
-
9
-
10
-
11
-
12
-
13
-
14
-
15
-
16
-
17
-
18
-
19
-
20
-
21
-
22
-
23
-
24
-
25
-
26
-
27
-
28
-
29
-
30
-
31
-
32
-
33
-
34
-
35
-
36
-
37
-
38
-
39
-
40
-
41
-
42
-
43
-
44
-
45
-
46
-
47
-
48
-
49
-
50
-
51
-
52
-
53
-
54
-
55
-
56
-
57
-
58
-
59
-
60
-
61
-
62
-
63
-
64
-
65
-
66
-
67
-
68
-
69
-
70
-
71
-
72
-
73
-
74
-
75
-
76
-
77
-
78
-
79
-
80
-
81
-
82
-
83
-
84
-
85
-
86
-
87
-
88
-
89
-
90
-
91
-
92
-
93
-
94
-
95
-
96
-
97
-
98
-
99
-
100
-
101
-
102
-
103
-
104
-
105
-
106
-
107
-
108
-
109
-
110
-
111
-
112
-
113
-
114
-
115
-
116
-
117
-
118
-
119
-
120
-
121
-
122
-
123
-
 124
124 -
 125
125 -
 126
126 -
 127
127 -
 128
128 -
 129
129 -
 130
130 -
 131
131 -
 132
132 -
 133
133 -
 134
134 -
 135
135 -
 136
136 -
 137
137 -
 138
138 -
 139
139 -
 140
140 -
 141
141 -
 142
142 -
 143
143 -
 144
144 -
145
-
146
-
147
-
148
-
149
-
150
-
151
-
152
-
153
-
154
-
155
-
156
-
157
-
158
-
159
-
160
-
161
-
162
-
163
-
164
-
165
-
166
-
167
-
168
-
169
-
170
-
171
-
172
-
173
-
174
-
175
-
176
-
177
-
178
-
179
-
180
-
181
-
182
-
183
-
184
-
185
-
186
-
187
-
188
-
189
-
190
-
191
-
192
-
193
-
194
-
195
-
196
-
197
-
198
-
199
-
200
-
201
-
202
-
203
-
204
-
205
-
206
-
207
-
208
-
209
-
210
-
211
-
212
-
213
-
214
-
215
-
216
-
217
-
218
-
219
-
220
-
221
-
222
-
223
-
224
-
225
-
226
-
227
-
228
-
229
-
230
-
231
-
232
-
233
-
234
-
235
-
236
-
237
-
238
-
239
-
240
-
241
-
242
-
243
-
244
-
245
-
246
-
247
-
248
-
249
-
250
-
251
-
252
-
253
-
254
-
255
-
256
-
257
-
258
-
259
-
260
-
261
-
262
-
263
-
264
-
265
-
266
-
267
-
268
-
269
-
270
-
271
-
272
-
273
-
274
-
275
-
276
-
277
-
278
-
279
-
280
-
281
-
282
-
283
-
284
 |
 |

of its net sales were 11.8% in 2012 compared with 10.2% in 2011 and 9.2% in 2010. Location &
Commerce R&D expenses represented 80.1% of its net sales in 2012, compared with 87.8% of its net
sales in 2011 and 116.3% in 2010. In the case of Nokia Siemens Networks, R&D expenses
represented 14.8%, 15.6% and 16.9% of its net sales in 2012, 2011 and 2010, respectively.
We will continue to invest in research and development in an appropriate manner to support our
strategic objectives.
5D. Trends Information
See Item 5A. “Operating Results – Principal Factors and Trends Affecting our Results of Operations”
for information on material trends affecting our business and results of operations.
5E. Off-Balance Sheet Arrangements
There are no material off-balance sheet arrangements that have or are reasonably likely to have a
current or future effect on our financial condition, changes in financial condition, revenues or expenses,
results of operations, liquidity, capital expenditures or capital resources that is material to investors.
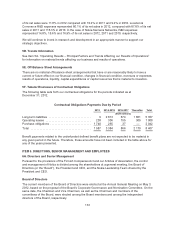
5F. Tabular Disclosure of Contractual Obligations
The following table sets forth our contractual obligations for the periods indicated as at
December 31, 2012.
Contractual Obligations Payments Due by Period
2013 2014-2015 2016-2017 Thereafter Total
(EUR millions)
Long-term liabilities ............................ 9 2813 674 1861 5357
Operating leases .............................. 238 306 155 309 1008
Purchase obligations ........................... 1740 265 37 — 2042
Total ........................................ 1987 3384 866 2170 8407
Benefit payments related to the underfunded defined benefit plans are not expected to be material in
any given period in the future. Therefore, these amounts have not been included in the table above for
any of the years presented.
ITEM 6. DIRECTORS, SENIOR MANAGEMENT AND EMPLOYEES
6A. Directors and Senior Management
Pursuant to the provisions of the Finnish Companies Act and our Articles of Association, the control
and management of Nokia is divided among the shareholders at a general meeting, the Board of
Directors (or the “Board”), the President and CEO, and the Nokia Leadership Team chaired by the
President and CEO.
Board of Directors
The current members of the Board of Directors were elected at the Annual General Meeting on May 3,
2012, based on the proposal of the Board’s Corporate Governance and Nomination Committee. On the
same date, the Chairman and Vice Chairman, as well as the Chairmen and members of the
committees of the Board, were elected among the Board members and among the independent
directors of the Board, respectively.
133