Nokia 2012 Annual Report Download - page 271
Download and view the complete annual report
Please find page 271 of the 2012 Nokia annual report below. You can navigate through the pages in the report by either clicking on the pages listed below, or by using the keyword search tool below to find specific information within the annual report.-
 1
1 -
2
-
3
-
4
-
5
-
6
-
7
-
8
-
9
-
10
-
11
-
12
-
13
-
14
-
15
-
16
-
17
-
18
-
19
-
20
-
21
-
22
-
23
-
24
-
25
-
26
-
27
-
28
-
29
-
30
-
31
-
32
-
33
-
34
-
35
-
36
-
37
-
38
-
39
-
40
-
41
-
42
-
43
-
44
-
45
-
46
-
47
-
48
-
49
-
50
-
51
-
52
-
53
-
54
-
55
-
56
-
57
-
58
-
59
-
60
-
61
-
62
-
63
-
64
-
65
-
66
-
67
-
68
-
69
-
70
-
71
-
72
-
73
-
74
-
75
-
76
-
77
-
78
-
79
-
80
-
81
-
82
-
83
-
84
-
85
-
86
-
87
-
88
-
89
-
90
-
91
-
92
-
93
-
94
-
95
-
96
-
97
-
98
-
99
-
100
-
101
-
102
-
103
-
104
-
105
-
106
-
107
-
108
-
109
-
110
-
111
-
112
-
113
-
114
-
115
-
116
-
117
-
118
-
119
-
120
-
121
-
122
-
123
-
124
-
125
-
126
-
127
-
128
-
129
-
130
-
131
-
132
-
133
-
134
-
135
-
136
-
137
-
138
-
139
-
140
-
141
-
142
-
143
-
144
-
145
-
146
-
147
-
148
-
149
-
150
-
151
-
152
-
153
-
154
-
155
-
156
-
157
-
158
-
159
-
160
-
161
-
162
-
163
-
164
-
165
-
166
-
167
-
168
-
169
-
170
-
171
-
172
-
173
-
174
-
175
-
176
-
177
-
178
-
179
-
180
-
181
-
182
-
183
-
184
-
185
-
186
-
187
-
188
-
189
-
190
-
191
-
192
-
193
-
194
-
195
-
196
-
197
-
198
-
199
-
200
-
201
-
202
-
203
-
204
-
205
-
206
-
207
-
208
-
209
-
210
-
211
-
212
-
213
-
214
-
215
-
216
-
217
-
218
-
219
-
220
-
221
-
222
-
223
-
224
-
225
-
226
-
227
-
228
-
229
-
230
-
231
-
232
-
233
-
234
-
235
-
236
-
237
-
238
-
239
-
240
-
241
-
242
-
243
-
244
-
245
-
246
-
247
-
248
-
249
-
250
-
251
-
252
-
253
-
254
-
255
-
256
-
257
-
258
-
259
-
260
-
 261
261 -
 262
262 -
 263
263 -
 264
264 -
 265
265 -
 266
266 -
 267
267 -
 268
268 -
 269
269 -
 270
270 -
 271
271 -
 272
272 -
 273
273 -
 274
274 -
 275
275 -
 276
276 -
 277
277 -
 278
278 -
 279
279 -
 280
280 -
 281
281 -
282
-
283
-
284
 |
 |

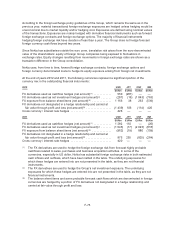
32. Notes to cash flow statement
2012 2011 2010
EURm EURm EURm
Adjustments for:
Depreciation and amortization (Note 10) ............................. 1 326 1 562 1 771
(Profit)/loss on sale of property, plant and equipment and available-for-sale
investments .................................................. (131) (49) (193)
Income taxes (Note 12) ........................................... 1 145 290 443
Share of results of associated companies (Note 15) ................... 123 (1)
Non-controlling interest ........................................... (683) (324) (507)
Financial income and expenses (Note 11) ............................ 333 49 191
Transfer from hedging reserve to sales and cost of sales (Note 21) ....... (16) (4) (22)
Impairment charges (Note 8) ...................................... 109 1 338 110
Asset retirements (Note 13) ....................................... 31 13 37
Share-based compensation (Note 24) ............................... 13 18 47
Restructuring and related charges(1) (Note 7, 27) ...................... 1 659 565 245
Other income and expenses ....................................... 51 5 (9)
Adjustments, total ................................................... 3 838 3 486 2 112
Change in net working capital
Decrease (increase) in short-term receivables ........................ 2 040 137 1 281
Decrease (increase) in inventories .................................. 707 289 (512)
(Decrease) increase in interest-free short-term borrowings .............. (2 702) (1 145) 1 563
Loans made to customers ......................................... 78 81 17
Change in net working capital ......................................... 123 (638) 2 349
(1) The adjustments for restructuring and related charges represent the non-cash portion of the
restructuring and related charges recognized in the income statement.
In 2010, Nokia Siemens Networks’ EUR 750 million loans and capitalized interest of EUR 16 million
from Siemens were converted into equity impacting the non-controlling interests in the Consolidated
Statements of Financial Position. The Group did not engage in any material non-cash investing
activities in 2012 and 2011.
F-70