Nokia 2012 Annual Report Download - page 126
Download and view the complete annual report
Please find page 126 of the 2012 Nokia annual report below. You can navigate through the pages in the report by either clicking on the pages listed below, or by using the keyword search tool below to find specific information within the annual report.-
 1
1 -
2
-
3
-
4
-
5
-
6
-
7
-
8
-
9
-
10
-
11
-
12
-
13
-
14
-
15
-
16
-
17
-
18
-
19
-
20
-
21
-
22
-
23
-
24
-
25
-
26
-
27
-
28
-
29
-
30
-
31
-
32
-
33
-
34
-
35
-
36
-
37
-
38
-
39
-
40
-
41
-
42
-
43
-
44
-
45
-
46
-
47
-
48
-
49
-
50
-
51
-
52
-
53
-
54
-
55
-
56
-
57
-
58
-
59
-
60
-
61
-
62
-
63
-
64
-
65
-
66
-
67
-
68
-
69
-
70
-
71
-
72
-
73
-
74
-
75
-
76
-
77
-
78
-
79
-
80
-
81
-
82
-
83
-
84
-
85
-
86
-
87
-
88
-
89
-
90
-
91
-
92
-
93
-
94
-
95
-
96
-
97
-
98
-
99
-
100
-
101
-
102
-
103
-
104
-
105
-
106
-
107
-
108
-
109
-
110
-
111
-
112
-
113
-
114
-
115
-
 116
116 -
 117
117 -
 118
118 -
 119
119 -
 120
120 -
 121
121 -
 122
122 -
 123
123 -
 124
124 -
 125
125 -
 126
126 -
 127
127 -
 128
128 -
 129
129 -
 130
130 -
 131
131 -
 132
132 -
 133
133 -
 134
134 -
 135
135 -
 136
136 -
137
-
138
-
139
-
140
-
141
-
142
-
143
-
144
-
145
-
146
-
147
-
148
-
149
-
150
-
151
-
152
-
153
-
154
-
155
-
156
-
157
-
158
-
159
-
160
-
161
-
162
-
163
-
164
-
165
-
166
-
167
-
168
-
169
-
170
-
171
-
172
-
173
-
174
-
175
-
176
-
177
-
178
-
179
-
180
-
181
-
182
-
183
-
184
-
185
-
186
-
187
-
188
-
189
-
190
-
191
-
192
-
193
-
194
-
195
-
196
-
197
-
198
-
199
-
200
-
201
-
202
-
203
-
204
-
205
-
206
-
207
-
208
-
209
-
210
-
211
-
212
-
213
-
214
-
215
-
216
-
217
-
218
-
219
-
220
-
221
-
222
-
223
-
224
-
225
-
226
-
227
-
228
-
229
-
230
-
231
-
232
-
233
-
234
-
235
-
236
-
237
-
238
-
239
-
240
-
241
-
242
-
243
-
244
-
245
-
246
-
247
-
248
-
249
-
250
-
251
-
252
-
253
-
254
-
255
-
256
-
257
-
258
-
259
-
260
-
261
-
262
-
263
-
264
-
265
-
266
-
267
-
268
-
269
-
270
-
271
-
272
-
273
-
274
-
275
-
276
-
277
-
278
-
279
-
280
-
281
-
282
-
283
-
284
 |
 |

actions across the portfolio, which partially affected the second quarter of 2011 and fully affected the third
quarter of 2011. In addition, the appreciation of the euro against certain currencies contributed to the
decline, which was partially offset by the positive impact from foreign currency hedging.
Gross Margin
Mobile Phones gross margin was 26.1% in 2011, down from 28.0% in 2010. The year-on-year decline
in our Mobile Phones gross margin in 2011 was due primarily to greater price erosion than cost erosion
due to the competitive environment and our tactical pricing actions across the portfolio which partially
affected the second quarter of 2011 and fully affected the third quarter of 2011, a negative impact from
foreign currency hedging and the appreciation of the euro against certain currencies, which were
partially offset by a product mix shift towards higher margin feature phones.
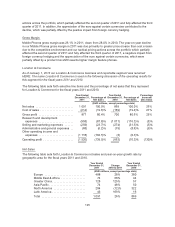
Location & Commerce
As of January 1, 2013 our Location & Commerce business and reportable segment was renamed
HERE. The name Location & Commerce is used in the following discussion of the operating results for
this segment for the fiscal years 2011 and 2010.
The following table sets forth selective line items and the percentage of net sales that they represent
for Location & Commerce for the fiscal years 2011 and 2010.
Year Ended
December 31,
2011
Percentage of
Net Sales
Year Ended
December 31,
2010
Percentage of
Net Sales
Percentage
Increase/
(Decrease)
(EUR millions, except percentage data)
Net sales ......................... 1091 100.0% 869 100.0% 26%
Cost of sales ...................... (214) (19.6)% (169) (19.4)% 27%
Gross profit ....................... 877 80.4% 700 80.6% 25%
Research and development
expenses ....................... (958) (87.8)% (1 011) (116.3)% (5)%
Selling and marketing expenses ...... (259) (23.7)% (274) (31.5)% (5)%
Administrative and general expenses . . (68) (6.2)% (75) (8.6)% (9)%
Other operating income and
expenses ....................... (1118) (102.5)% (3) (0.3)%
Operating profit .................... (1526) (139.9)% (663) (76.3)% (130)%
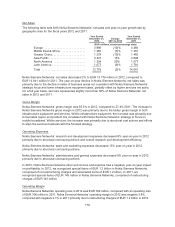
Net Sales
The following table sets forth Location & Commerce net sales and year-on-year growth rate by
geographic area for the fiscal years 2011 and 2010.
Year Ended
December 31,
2011
Change
2010 to 2011
Year Ended
December 31,
2010
(EUR millions, except percentage data)
Europe ........................... 488 28% 380
Middle East & Africa ................ 74 68% 44
Greater China ...................... 128 125% 57
Asia-Pacific ........................ 74 48% 50
North America ..................... 284 (12)% 322
Latin America ...................... 43 169% 16
Total ............................. 1091 26% 869
125