Nokia 2012 Annual Report Download - page 133
Download and view the complete annual report
Please find page 133 of the 2012 Nokia annual report below. You can navigate through the pages in the report by either clicking on the pages listed below, or by using the keyword search tool below to find specific information within the annual report.-
 1
1 -
2
-
3
-
4
-
5
-
6
-
7
-
8
-
9
-
10
-
11
-
12
-
13
-
14
-
15
-
16
-
17
-
18
-
19
-
20
-
21
-
22
-
23
-
24
-
25
-
26
-
27
-
28
-
29
-
30
-
31
-
32
-
33
-
34
-
35
-
36
-
37
-
38
-
39
-
40
-
41
-
42
-
43
-
44
-
45
-
46
-
47
-
48
-
49
-
50
-
51
-
52
-
53
-
54
-
55
-
56
-
57
-
58
-
59
-
60
-
61
-
62
-
63
-
64
-
65
-
66
-
67
-
68
-
69
-
70
-
71
-
72
-
73
-
74
-
75
-
76
-
77
-
78
-
79
-
80
-
81
-
82
-
83
-
84
-
85
-
86
-
87
-
88
-
89
-
90
-
91
-
92
-
93
-
94
-
95
-
96
-
97
-
98
-
99
-
100
-
101
-
102
-
103
-
104
-
105
-
106
-
107
-
108
-
109
-
110
-
111
-
112
-
113
-
114
-
115
-
116
-
117
-
118
-
119
-
120
-
121
-
122
-
 123
123 -
 124
124 -
 125
125 -
 126
126 -
 127
127 -
 128
128 -
 129
129 -
 130
130 -
 131
131 -
 132
132 -
 133
133 -
 134
134 -
 135
135 -
 136
136 -
 137
137 -
 138
138 -
 139
139 -
 140
140 -
 141
141 -
 142
142 -
 143
143 -
144
-
145
-
146
-
147
-
148
-
149
-
150
-
151
-
152
-
153
-
154
-
155
-
156
-
157
-
158
-
159
-
160
-
161
-
162
-
163
-
164
-
165
-
166
-
167
-
168
-
169
-
170
-
171
-
172
-
173
-
174
-
175
-
176
-
177
-
178
-
179
-
180
-
181
-
182
-
183
-
184
-
185
-
186
-
187
-
188
-
189
-
190
-
191
-
192
-
193
-
194
-
195
-
196
-
197
-
198
-
199
-
200
-
201
-
202
-
203
-
204
-
205
-
206
-
207
-
208
-
209
-
210
-
211
-
212
-
213
-
214
-
215
-
216
-
217
-
218
-
219
-
220
-
221
-
222
-
223
-
224
-
225
-
226
-
227
-
228
-
229
-
230
-
231
-
232
-
233
-
234
-
235
-
236
-
237
-
238
-
239
-
240
-
241
-
242
-
243
-
244
-
245
-
246
-
247
-
248
-
249
-
250
-
251
-
252
-
253
-
254
-
255
-
256
-
257
-
258
-
259
-
260
-
261
-
262
-
263
-
264
-
265
-
266
-
267
-
268
-
269
-
270
-
271
-
272
-
273
-
274
-
275
-
276
-
277
-
278
-
279
-
280
-
281
-
282
-
283
-
284
 |
 |

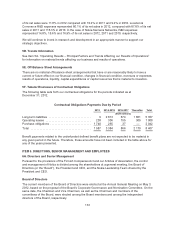
The structured financing commitments are available under loan facilities mainly negotiated with
customers of Nokia Siemens Networks. Availability of the amounts is dependent upon the borrowers’
continuing compliance with stated financial and operational covenants and compliance with other
administrative terms of the facilities. The customer loans are available to fund capital expenditure
relating to the purchase of network infrastructure equipment and services from Nokia Siemens
Networks.
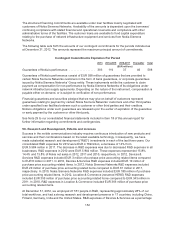
The following table sets forth the amounts of our contingent commitments for the periods indicated as
at December 31, 2012. The amounts represent the maximum principal amount of commitments.
Contingent Commitments Expiration Per Period
2013 2014-2015 2016-2017 Thereafter Total
(EUR millions)
Guarantees of Nokia’s performance ................. 393 119 37 49 598
Guarantees of Nokia’s performance consist of EUR 598 million of guarantees that are provided to
certain Nokia Siemens Networks customers in the form of bank guarantees, or corporate guarantees
issued by Nokia Siemens Networks’ Group entity. These instruments entitle the customer to claim
payment as compensation for non-performance by Nokia Siemens Networks of its obligations under
network infrastructure supply agreements. Depending on the nature of the instrument, compensation is
payable either on demand, or is subject to verification of non-performance.
Financial guarantees and securities pledged that we may give on behalf of customers represent
guarantees relating to payment by certain Nokia Siemens Networks’ customers and other third parties
under specified loan facilities between such a customer or other third parties and their creditors.
Nokia’s obligations under such guarantees are released upon the earlier of expiration of the guarantee
or early payment by the customer or other third party.
See Note 29 to our consolidated financial statements included in Item 18 of this annual report for
further information regarding commitments and contingencies.
5C. Research and Development, Patents and Licenses
Success in the mobile communications industry requires continuous introduction of new products and
services and their combinations based on the latest available technology. Consequently, we have
made substantial research and development (“R&D”) investments in each of the last three years. Our
consolidated R&D expenses for 2012 were EUR 4 782million, a decrease of 14% from
EUR 5 584 million in 2011. The decrease in R&D expenses was due to decreased R&D expenses in all
businesses. R&D expenses in 2010 were EUR 5 844 million. These expenses represented 15.8%,
14.4% and 13.8% of Nokia net sales in 2012, 2011 and 2010, respectively. In 2012, Devices &
Services R&D expenses included EUR 3 million of purchase price accounting related items compared
to EUR 8 million in 2011. In 2010, Devices & Services R&D expenses included EUR 10 million of
purchase price accounting related items. In 2012, Nokia Siemens Networks R&D expenses included
EUR 20 million of purchase price accounting related items compared to EUR 61 million in 2011,
respectively. In 2010, Nokia Siemens Networks R&D expenses included EUR 180 million of purchase
price accounting related items. In 2012, Location & Commerce (renamed HERE) R&D expenses
included EUR 355 million of purchase price accounting related items compared to EUR 343 million in
2011. In 2010, R&D expenses in Location & Commerce included EUR 366 million of purchase price
accounting related items.
At December 31, 2012, we employed 27 551 people in R&D, representing approximately 28% of our
total workforce, and had a strong research and development presence in 17 countries, including China,
Finland, Germany, India and the United States. R&D expenses of Devices & Services as a percentage
132