Nokia 2012 Annual Report Download - page 116
Download and view the complete annual report
Please find page 116 of the 2012 Nokia annual report below. You can navigate through the pages in the report by either clicking on the pages listed below, or by using the keyword search tool below to find specific information within the annual report.-
 1
1 -
2
-
3
-
4
-
5
-
6
-
7
-
8
-
9
-
10
-
11
-
12
-
13
-
14
-
15
-
16
-
17
-
18
-
19
-
20
-
21
-
22
-
23
-
24
-
25
-
26
-
27
-
28
-
29
-
30
-
31
-
32
-
33
-
34
-
35
-
36
-
37
-
38
-
39
-
40
-
41
-
42
-
43
-
44
-
45
-
46
-
47
-
48
-
49
-
50
-
51
-
52
-
53
-
54
-
55
-
56
-
57
-
58
-
59
-
60
-
61
-
62
-
63
-
64
-
65
-
66
-
67
-
68
-
69
-
70
-
71
-
72
-
73
-
74
-
75
-
76
-
77
-
78
-
79
-
80
-
81
-
82
-
83
-
84
-
85
-
86
-
87
-
88
-
89
-
90
-
91
-
92
-
93
-
94
-
95
-
96
-
97
-
98
-
99
-
100
-
101
-
102
-
103
-
104
-
105
-
 106
106 -
 107
107 -
 108
108 -
 109
109 -
 110
110 -
 111
111 -
 112
112 -
 113
113 -
 114
114 -
 115
115 -
 116
116 -
 117
117 -
 118
118 -
 119
119 -
 120
120 -
 121
121 -
 122
122 -
 123
123 -
 124
124 -
 125
125 -
 126
126 -
127
-
128
-
129
-
130
-
131
-
132
-
133
-
134
-
135
-
136
-
137
-
138
-
139
-
140
-
141
-
142
-
143
-
144
-
145
-
146
-
147
-
148
-
149
-
150
-
151
-
152
-
153
-
154
-
155
-
156
-
157
-
158
-
159
-
160
-
161
-
162
-
163
-
164
-
165
-
166
-
167
-
168
-
169
-
170
-
171
-
172
-
173
-
174
-
175
-
176
-
177
-
178
-
179
-
180
-
181
-
182
-
183
-
184
-
185
-
186
-
187
-
188
-
189
-
190
-
191
-
192
-
193
-
194
-
195
-
196
-
197
-
198
-
199
-
200
-
201
-
202
-
203
-
204
-
205
-
206
-
207
-
208
-
209
-
210
-
211
-
212
-
213
-
214
-
215
-
216
-
217
-
218
-
219
-
220
-
221
-
222
-
223
-
224
-
225
-
226
-
227
-
228
-
229
-
230
-
231
-
232
-
233
-
234
-
235
-
236
-
237
-
238
-
239
-
240
-
241
-
242
-
243
-
244
-
245
-
246
-
247
-
248
-
249
-
250
-
251
-
252
-
253
-
254
-
255
-
256
-
257
-
258
-
259
-
260
-
261
-
262
-
263
-
264
-
265
-
266
-
267
-
268
-
269
-
270
-
271
-
272
-
273
-
274
-
275
-
276
-
277
-
278
-
279
-
280
-
281
-
282
-
283
-
284
 |
 |

Location & Commerce sales and marketing expenses decreased 28% primarily driven by a focus on
cost controls and lower marketing spending.
Location & Commerce administrative and general expenses increased 13% primarily driven by higher
use of services provided by shared support functions.
In 2012, Location & Commerce other income and expense had a positive year-on-year impact on
profitability. In 2012, we recognized special items of EUR 31 million in Location & Commerce,
comprised of restructuring charges of EUR 31 million. In 2011, we recognized special items of EUR 1.1
billion in Location & Commerce, comprised of restructuring charges of EUR 25 million and impairment
of goodwill of EUR 1.1 billion.
Operating Margin
Location & Commerce operating loss decreased to EUR 301 million in 2012, compared with a loss of
EUR 1 526 million in 2011. Location & Commerce operating margin in 2012 was negative 27.3%,
compared with negative 139.9% in 2011. The year-on-year improvement in operating margin in 2012
was driven primarily by the lower other operating expenses due to the impairment of Location &
Commerce’s goodwill of EUR 1.1 billion in 2011.
Nokia Siemens Networks
Nokia Siemens Networks completed the acquisition of the majority of Motorola Solutions’ wireless
network infrastructure assets on April 30, 2011. Accordingly, the results of Nokia Siemens Networks for
2012 are not directly comparable to 2011.
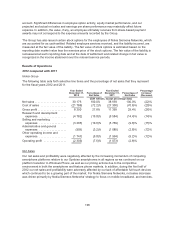
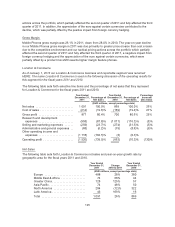
The following table sets forth selective line items and the percentage of net sales that they represent
for Nokia Siemens Networks for the fiscal years 2012 and 2011.
Year Ended
December 31,
2012
Percentage of
Net Sales
Year Ended
December 31,
2011
Percentage of
Net Sales
Percentage
Increase/
(Decrease)
(EUR millions, except percentage data)
Net sales ..................... 13779 100.0% 14 041 100.0% (2)%
Cost of Sales ................. (9610) (69.7)% (10 199) (72.6)% (6)%
Gross profit ................... 4169 30.3% 3 842 27.4% 9%
Research and development
expenses .................. (2046) (14.9)% (2 185) (15.6)% (6)%
Selling and marketing
expenses .................. (1158) (8.4)% (1 328) (9.4)% (13)%
Administrative and general
expenses .................. (474) (3.4)% (517) (3.7)% (8)%
Other income and expenses ..... (1290) (9.4)% (112) (0.8)%
Operating profit ............... (799) (5.8)% (300) (2.1)% (166)%
115