Nokia 2012 Annual Report Download - page 240
Download and view the complete annual report
Please find page 240 of the 2012 Nokia annual report below. You can navigate through the pages in the report by either clicking on the pages listed below, or by using the keyword search tool below to find specific information within the annual report.-
 1
1 -
2
-
3
-
4
-
5
-
6
-
7
-
8
-
9
-
10
-
11
-
12
-
13
-
14
-
15
-
16
-
17
-
18
-
19
-
20
-
21
-
22
-
23
-
24
-
25
-
26
-
27
-
28
-
29
-
30
-
31
-
32
-
33
-
34
-
35
-
36
-
37
-
38
-
39
-
40
-
41
-
42
-
43
-
44
-
45
-
46
-
47
-
48
-
49
-
50
-
51
-
52
-
53
-
54
-
55
-
56
-
57
-
58
-
59
-
60
-
61
-
62
-
63
-
64
-
65
-
66
-
67
-
68
-
69
-
70
-
71
-
72
-
73
-
74
-
75
-
76
-
77
-
78
-
79
-
80
-
81
-
82
-
83
-
84
-
85
-
86
-
87
-
88
-
89
-
90
-
91
-
92
-
93
-
94
-
95
-
96
-
97
-
98
-
99
-
100
-
101
-
102
-
103
-
104
-
105
-
106
-
107
-
108
-
109
-
110
-
111
-
112
-
113
-
114
-
115
-
116
-
117
-
118
-
119
-
120
-
121
-
122
-
123
-
124
-
125
-
126
-
127
-
128
-
129
-
130
-
131
-
132
-
133
-
134
-
135
-
136
-
137
-
138
-
139
-
140
-
141
-
142
-
143
-
144
-
145
-
146
-
147
-
148
-
149
-
150
-
151
-
152
-
153
-
154
-
155
-
156
-
157
-
158
-
159
-
160
-
161
-
162
-
163
-
164
-
165
-
166
-
167
-
168
-
169
-
170
-
171
-
172
-
173
-
174
-
175
-
176
-
177
-
178
-
179
-
180
-
181
-
182
-
183
-
184
-
185
-
186
-
187
-
188
-
189
-
190
-
191
-
192
-
193
-
194
-
195
-
196
-
197
-
198
-
199
-
200
-
201
-
202
-
203
-
204
-
205
-
206
-
207
-
208
-
209
-
210
-
211
-
212
-
213
-
214
-
215
-
216
-
217
-
218
-
219
-
220
-
221
-
222
-
223
-
224
-
225
-
226
-
227
-
228
-
229
-
 230
230 -
 231
231 -
 232
232 -
 233
233 -
 234
234 -
 235
235 -
 236
236 -
 237
237 -
 238
238 -
 239
239 -
 240
240 -
 241
241 -
 242
242 -
 243
243 -
 244
244 -
 245
245 -
 246
246 -
 247
247 -
 248
248 -
 249
249 -
 250
250 -
251
-
252
-
253
-
254
-
255
-
256
-
257
-
258
-
259
-
260
-
261
-
262
-
263
-
264
-
265
-
266
-
267
-
268
-
269
-
270
-
271
-
272
-
273
-
274
-
275
-
276
-
277
-
278
-
279
-
280
-
281
-
282
-
283
-
284
 |
 |

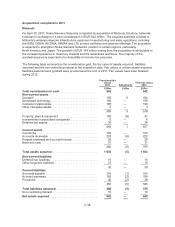
In 2011, Nokia Siemens Networks had concluded on a working capital adjustment settlement with respect
to the acquisition whereby Motorola Solutions agreed to make additional installment payments to Nokia
Siemens Networks. The installment payments were subject to certain conditions that Nokia Siemens
Networks must fulfil over a given time period. The maximum amount of installment payments receivable
totalled EUR 85 million and Nokia Siemens Networks had determined that the fair value of the installment
payments amounted to EUR 81 million. During 2012, the working capital adjustment arrangement has been
settled and Nokia Siemens Networks received the maximum amount of installment payments. As a result,
EUR 4 million gain has been recognized in other operating income.
The fair value of accounts receivable of EUR 222 million includes trade receivables with a fair value of
EUR 146 million. The gross contractual amount for trade receivables due is EUR 255 million, of which
EUR 109 million is expected to be uncollectible.
Acquisition related costs of EUR 4 million and EUR 8 million have been charged to administrative and
general expenses in the consolidated income statement for the years ended December 31, 2011 and
December 31, 2010, respectively.
From April 30, 2011, the consolidated statement of comprehensive income includes revenue and net
loss contributed by the Motorola Solutions’ networks business of EUR 894 million and EUR 4 million,
respectively.
Had Motorola Solutions’ networks business been consolidated from January 1, 2011, the Group
consolidated statement of income for 2011 would have shown revenue of EUR 39 445 million and loss
of EUR 1 402 million. This unaudited pro forma information is not necessarily indicative of the results of
the combined operations had the acquisition actually occurred on January 1, 2011, nor is it indicative of
the future results of the combined operations.
During 2011, the Group completed additional acquisitions that in aggregate did not have a material
impact on the consolidated financial statements.
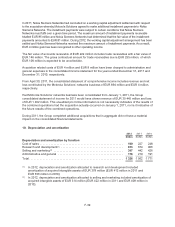
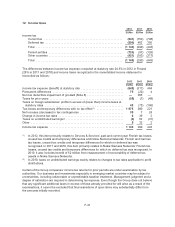
10. Depreciation and amortization
2012 2011 2010
EURm EURm EURm
Depreciation and amortization by function
Cost of sales ....................................................... 190 227 248
Research and development(1) ......................................... 613 674 906
Selling and marketing(2) .............................................. 347 442 426
Administrative and general ........................................... 176 219 191
Total .............................................................. 1 326 1 562 1 771
(1) In 2012, depreciation and amortization allocated to research and development included
amortization of acquired intangible assets of EUR 378 million (EUR 412 million in 2011 and
EUR 556 million in 2010).
(2) In 2012, depreciation and amortization allocated to selling and marketing included amortization of
acquired intangible assets of EUR 314 million (EUR 422 million in 2011 and EUR 408 million in
2010).
F-39