Nokia 2012 Annual Report Download - page 209
Download and view the complete annual report
Please find page 209 of the 2012 Nokia annual report below. You can navigate through the pages in the report by either clicking on the pages listed below, or by using the keyword search tool below to find specific information within the annual report.-
 1
1 -
2
-
3
-
4
-
5
-
6
-
7
-
8
-
9
-
10
-
11
-
12
-
13
-
14
-
15
-
16
-
17
-
18
-
19
-
20
-
21
-
22
-
23
-
24
-
25
-
26
-
27
-
28
-
29
-
30
-
31
-
32
-
33
-
34
-
35
-
36
-
37
-
38
-
39
-
40
-
41
-
42
-
43
-
44
-
45
-
46
-
47
-
48
-
49
-
50
-
51
-
52
-
53
-
54
-
55
-
56
-
57
-
58
-
59
-
60
-
61
-
62
-
63
-
64
-
65
-
66
-
67
-
68
-
69
-
70
-
71
-
72
-
73
-
74
-
75
-
76
-
77
-
78
-
79
-
80
-
81
-
82
-
83
-
84
-
85
-
86
-
87
-
88
-
89
-
90
-
91
-
92
-
93
-
94
-
95
-
96
-
97
-
98
-
99
-
100
-
101
-
102
-
103
-
104
-
105
-
106
-
107
-
108
-
109
-
110
-
111
-
112
-
113
-
114
-
115
-
116
-
117
-
118
-
119
-
120
-
121
-
122
-
123
-
124
-
125
-
126
-
127
-
128
-
129
-
130
-
131
-
132
-
133
-
134
-
135
-
136
-
137
-
138
-
139
-
140
-
141
-
142
-
143
-
144
-
145
-
146
-
147
-
148
-
149
-
150
-
151
-
152
-
153
-
154
-
155
-
156
-
157
-
158
-
159
-
160
-
161
-
162
-
163
-
164
-
165
-
166
-
167
-
168
-
169
-
170
-
171
-
172
-
173
-
174
-
175
-
176
-
177
-
178
-
179
-
180
-
181
-
182
-
183
-
184
-
185
-
186
-
187
-
188
-
189
-
190
-
191
-
192
-
193
-
194
-
195
-
196
-
197
-
198
-
 199
199 -
 200
200 -
 201
201 -
 202
202 -
 203
203 -
 204
204 -
 205
205 -
 206
206 -
 207
207 -
 208
208 -
 209
209 -
 210
210 -
 211
211 -
 212
212 -
 213
213 -
 214
214 -
 215
215 -
 216
216 -
 217
217 -
 218
218 -
 219
219 -
220
-
221
-
222
-
223
-
224
-
225
-
226
-
227
-
228
-
229
-
230
-
231
-
232
-
233
-
234
-
235
-
236
-
237
-
238
-
239
-
240
-
241
-
242
-
243
-
244
-
245
-
246
-
247
-
248
-
249
-
250
-
251
-
252
-
253
-
254
-
255
-
256
-
257
-
258
-
259
-
260
-
261
-
262
-
263
-
264
-
265
-
266
-
267
-
268
-
269
-
270
-
271
-
272
-
273
-
274
-
275
-
276
-
277
-
278
-
279
-
280
-
281
-
282
-
283
-
284
 |
 |

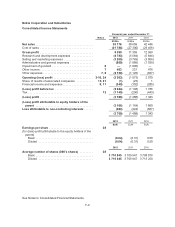
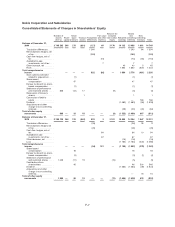
Nokia Corporation and Subsidiaries
Consolidated Statements of Changes in Shareholders’ Equity (Continued)
Number of
shares
(000’s) Share
capital
Share
issue
premium Treasury
shares Translation
differences
Fair value
and other
reserves
Reserve for
invested
non-restrict.
equity Retained
earnings
Before
non-
controlling
interests
Non-
controlling
interests Total
Balance at December 31,
2011 ......................3 710 189 246 362 (644) 771 154 3 148 7 836 11 873 2 043 13 916
Translation differences ..... 40 40 (2) 38
Net investment hedges, net
oftax.................. (67) (67) (67)
Cash flow hedges, net of
tax.................... (67) (67) 47 (20)
Available-for-sale
investments, net of tax . . . 36 36 36
Other increase, net ........ 77310
Loss .................... (3106) (3 106) (683) (3 789)
Total comprehensive income .. — — — (27) (31) — (3 099) (3 157) (635) (3 792)
Share-based compensation 1 1 1
Excess tax benefit on share-
based compensation ..... 3 3 3
Settlement of performance
and restricted shares .... 796 (5) 15 (12) (2) (2)
Dividend ................. (742) (742) (22) (764)
Convertible bond - equity
component ............. 85 85 85
Total of other equity
movements ............... 796 — 84 15 — — (12) (742) (655) (22) (677)
Balance at December 31,
2012 ......................3 710 985 246 446 (629) 744 123 3 136 3 995 8 061 1 386 9 447
Dividends declared per share were EUR 0.00 for 2012 (EUR 0.20 for 2011 and EUR 0.40 for 2010), subject to shareholders’
approval.
See Notes to Consolidated Financial Statements.
F-8