Nokia 2012 Annual Report Download - page 206
Download and view the complete annual report
Please find page 206 of the 2012 Nokia annual report below. You can navigate through the pages in the report by either clicking on the pages listed below, or by using the keyword search tool below to find specific information within the annual report.-
 1
1 -
2
-
3
-
4
-
5
-
6
-
7
-
8
-
9
-
10
-
11
-
12
-
13
-
14
-
15
-
16
-
17
-
18
-
19
-
20
-
21
-
22
-
23
-
24
-
25
-
26
-
27
-
28
-
29
-
30
-
31
-
32
-
33
-
34
-
35
-
36
-
37
-
38
-
39
-
40
-
41
-
42
-
43
-
44
-
45
-
46
-
47
-
48
-
49
-
50
-
51
-
52
-
53
-
54
-
55
-
56
-
57
-
58
-
59
-
60
-
61
-
62
-
63
-
64
-
65
-
66
-
67
-
68
-
69
-
70
-
71
-
72
-
73
-
74
-
75
-
76
-
77
-
78
-
79
-
80
-
81
-
82
-
83
-
84
-
85
-
86
-
87
-
88
-
89
-
90
-
91
-
92
-
93
-
94
-
95
-
96
-
97
-
98
-
99
-
100
-
101
-
102
-
103
-
104
-
105
-
106
-
107
-
108
-
109
-
110
-
111
-
112
-
113
-
114
-
115
-
116
-
117
-
118
-
119
-
120
-
121
-
122
-
123
-
124
-
125
-
126
-
127
-
128
-
129
-
130
-
131
-
132
-
133
-
134
-
135
-
136
-
137
-
138
-
139
-
140
-
141
-
142
-
143
-
144
-
145
-
146
-
147
-
148
-
149
-
150
-
151
-
152
-
153
-
154
-
155
-
156
-
157
-
158
-
159
-
160
-
161
-
162
-
163
-
164
-
165
-
166
-
167
-
168
-
169
-
170
-
171
-
172
-
173
-
174
-
175
-
176
-
177
-
178
-
179
-
180
-
181
-
182
-
183
-
184
-
185
-
186
-
187
-
188
-
189
-
190
-
191
-
192
-
193
-
194
-
195
-
 196
196 -
 197
197 -
 198
198 -
 199
199 -
 200
200 -
 201
201 -
 202
202 -
 203
203 -
 204
204 -
 205
205 -
 206
206 -
 207
207 -
 208
208 -
 209
209 -
 210
210 -
 211
211 -
 212
212 -
 213
213 -
 214
214 -
 215
215 -
 216
216 -
217
-
218
-
219
-
220
-
221
-
222
-
223
-
224
-
225
-
226
-
227
-
228
-
229
-
230
-
231
-
232
-
233
-
234
-
235
-
236
-
237
-
238
-
239
-
240
-
241
-
242
-
243
-
244
-
245
-
246
-
247
-
248
-
249
-
250
-
251
-
252
-
253
-
254
-
255
-
256
-
257
-
258
-
259
-
260
-
261
-
262
-
263
-
264
-
265
-
266
-
267
-
268
-
269
-
270
-
271
-
272
-
273
-
274
-
275
-
276
-
277
-
278
-
279
-
280
-
281
-
282
-
283
-
284
 |
 |

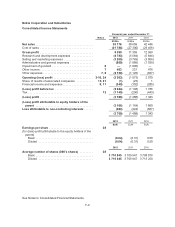
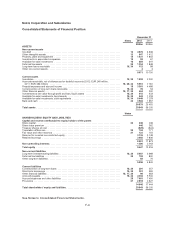
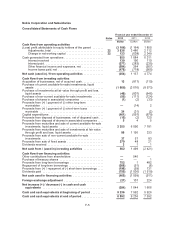
Nokia Corporation and Subsidiaries
Consolidated Statements of Cash Flows
Financial year ended December 31
Notes 2012 2011 2010
EURm EURm EURm
Cash flow from operating activities
(Loss) profit attributable to equity holders of the parent ....... (3 106) (1 164) 1 850
Adjustments, total .................................. 32 3 838 3 486 2 112
Change in net working capital ........................ 32 123 (638) 2 349
Cash generated from operations .......................... 855 1 684 6 311
Interest received ................................... 130 190 110
Interest paid ....................................... (277) (283) (235)
Other financial income and expenses, net .............. (584) 264 (507)
Income taxes paid, net .............................. (478) (718) (905)
Net cash (used in) / from operating activities ............. (354) 1 137 4 774
Cash flow from investing activities
Acquisition of businesses, net of acquired cash .............. 13 (817) (110)
Purchase of current available-for-sale investments, liquid
assets ............................................. (1 668) (3 676) (8 573)
Purchase of investments at fair value through profit and loss,
liquid assets ........................................ (40) (607) (646)
Purchase of non-current available-for-sale investments ....... (55) (111) (124)
Purchase of shares in associated companies ............... (1) (2) (33)
Proceeds from (+) / payment of (-) other long-term
receivables ......................................... —(14) 2
Proceeds from (+) / payment of (-) short-term loans
receivable .......................................... 24 (31) (2)
Capital expenditures .................................... (461) (597) (679)
Proceeds from disposal of businesses, net of disposed cash . . . (15) (2) 120
Proceeds from disposal of shares in associated companies .... 545
Proceeds from maturities and sale of current available-for-sale
investments, liquid assets ............................. 2 355 6 090 7 181
Proceeds from maturities and sale of investments at fair value
through profit and loss, liquid assets ..................... 86 1 156 333
Proceeds from sale of non-current available-for-sale
investments ......................................... 37 57 83
Proceeds from sale of fixed assets ........................ 279 48 21
Dividends received ..................................... 311
Net cash from / (used in) investing activities ............. 562 1 499 (2 421)
Cash flow from financing activities
Other contributions from shareholders ..................... —546 —
Purchase of treasury shares ............................. ——1
Proceeds from long-term borrowings ...................... 752 1 482
Repayment of long-term borrowings ....................... (266) (51) (6)
Proceeds from (+) / repayment of (-) short-term borrowings .... (196) (59) 131
Dividends paid ........................................ (755) (1 536) (1 519)
Net cash used in financing activities .................... (465) (1 099) (911)
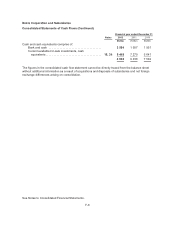
Foreign exchange adjustment .......................... (27) 107 224
Net increase (+) / decrease (-) in cash and cash
equivalents ........................................ (284) 1 644 1 666
Cash and cash equivalents at beginning of period ........ 9 236 7 592 5 926
Cash and cash equivalents at end of period .............. 8 952 9 236 7 592
F-5