Nokia 2012 Annual Report Download - page 203
Download and view the complete annual report
Please find page 203 of the 2012 Nokia annual report below. You can navigate through the pages in the report by either clicking on the pages listed below, or by using the keyword search tool below to find specific information within the annual report.-
 1
1 -
2
-
3
-
4
-
5
-
6
-
7
-
8
-
9
-
10
-
11
-
12
-
13
-
14
-
15
-
16
-
17
-
18
-
19
-
20
-
21
-
22
-
23
-
24
-
25
-
26
-
27
-
28
-
29
-
30
-
31
-
32
-
33
-
34
-
35
-
36
-
37
-
38
-
39
-
40
-
41
-
42
-
43
-
44
-
45
-
46
-
47
-
48
-
49
-
50
-
51
-
52
-
53
-
54
-
55
-
56
-
57
-
58
-
59
-
60
-
61
-
62
-
63
-
64
-
65
-
66
-
67
-
68
-
69
-
70
-
71
-
72
-
73
-
74
-
75
-
76
-
77
-
78
-
79
-
80
-
81
-
82
-
83
-
84
-
85
-
86
-
87
-
88
-
89
-
90
-
91
-
92
-
93
-
94
-
95
-
96
-
97
-
98
-
99
-
100
-
101
-
102
-
103
-
104
-
105
-
106
-
107
-
108
-
109
-
110
-
111
-
112
-
113
-
114
-
115
-
116
-
117
-
118
-
119
-
120
-
121
-
122
-
123
-
124
-
125
-
126
-
127
-
128
-
129
-
130
-
131
-
132
-
133
-
134
-
135
-
136
-
137
-
138
-
139
-
140
-
141
-
142
-
143
-
144
-
145
-
146
-
147
-
148
-
149
-
150
-
151
-
152
-
153
-
154
-
155
-
156
-
157
-
158
-
159
-
160
-
161
-
162
-
163
-
164
-
165
-
166
-
167
-
168
-
169
-
170
-
171
-
172
-
173
-
174
-
175
-
176
-
177
-
178
-
179
-
180
-
181
-
182
-
183
-
184
-
185
-
186
-
187
-
188
-
189
-
190
-
191
-
192
-
 193
193 -
 194
194 -
 195
195 -
 196
196 -
 197
197 -
 198
198 -
 199
199 -
 200
200 -
 201
201 -
 202
202 -
 203
203 -
 204
204 -
 205
205 -
 206
206 -
 207
207 -
 208
208 -
 209
209 -
 210
210 -
 211
211 -
 212
212 -
 213
213 -
214
-
215
-
216
-
217
-
218
-
219
-
220
-
221
-
222
-
223
-
224
-
225
-
226
-
227
-
228
-
229
-
230
-
231
-
232
-
233
-
234
-
235
-
236
-
237
-
238
-
239
-
240
-
241
-
242
-
243
-
244
-
245
-
246
-
247
-
248
-
249
-
250
-
251
-
252
-
253
-
254
-
255
-
256
-
257
-
258
-
259
-
260
-
261
-
262
-
263
-
264
-
265
-
266
-
267
-
268
-
269
-
270
-
271
-
272
-
273
-
274
-
275
-
276
-
277
-
278
-
279
-
280
-
281
-
282
-
283
-
284
 |
 |

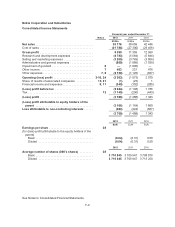
Nokia Corporation and Subsidiaries
Consolidated Income Statements
Notes
Financial year ended December 31
2012 2011 2010
EURm EURm EURm
Net sales ...................................... 30 176 38 659 42 446
Cost of sales ................................... (21 786) (27 300) (29 456)
Gross profit ................................... 8 390 11 359 12 990
Research and development expenses .............. (4 782) (5 584) (5 844)
Selling and marketing expenses ................... (3 205) (3 769) (3 856)
Administrative and general expenses ............... (959) (1 085) (1 039)
Impairment of goodwill ........................... 8—(1 090) —
Other income ................................... 7 403 221 476
Other expenses ................................. 7, 8 (2 150) (1 125) (657)
Operating (loss) profit .......................... 2-10, 24 (2 303) (1 073) 2 070
Share of results of associated companies ........... 15, 31 (1) (23) 1
Financial income and expenses .................... 8, 11 (340) (102) (285)
(Loss) profit before tax ......................... (2 644) (1 198) 1 786
Tax........................................... 12 (1 145) (290) (443)
(Loss) profit ................................... (3 789) (1 488) 1 343
(Loss) profit attributable to equity holders of the
parent ...................................... (3 106) (1 164) 1 850
Loss attributable to non-controlling interests ...... (683) (324) (507)
(3 789) (1 488) 1 343
2012 2011 2010
EUR EUR EUR
Earnings per share ............................. 28
(for (loss) profit attributable to the equity holders of the
parent)
Basic ...................................... (0.84) (0.31) 0.50
Diluted .................................... (0.84) (0.31) 0.50
2012 2011 2010
Average number of shares (000’s shares) ......... 28
Basic ...................................... 3 710 845 3 709 947 3 708 816
Diluted .................................... 3 710 845 3 709 947 3 713 250
See Notes to Consolidated Financial Statements.
F-2