Nokia 2012 Annual Report Download - page 237
Download and view the complete annual report
Please find page 237 of the 2012 Nokia annual report below. You can navigate through the pages in the report by either clicking on the pages listed below, or by using the keyword search tool below to find specific information within the annual report.-
 1
1 -
2
-
3
-
4
-
5
-
6
-
7
-
8
-
9
-
10
-
11
-
12
-
13
-
14
-
15
-
16
-
17
-
18
-
19
-
20
-
21
-
22
-
23
-
24
-
25
-
26
-
27
-
28
-
29
-
30
-
31
-
32
-
33
-
34
-
35
-
36
-
37
-
38
-
39
-
40
-
41
-
42
-
43
-
44
-
45
-
46
-
47
-
48
-
49
-
50
-
51
-
52
-
53
-
54
-
55
-
56
-
57
-
58
-
59
-
60
-
61
-
62
-
63
-
64
-
65
-
66
-
67
-
68
-
69
-
70
-
71
-
72
-
73
-
74
-
75
-
76
-
77
-
78
-
79
-
80
-
81
-
82
-
83
-
84
-
85
-
86
-
87
-
88
-
89
-
90
-
91
-
92
-
93
-
94
-
95
-
96
-
97
-
98
-
99
-
100
-
101
-
102
-
103
-
104
-
105
-
106
-
107
-
108
-
109
-
110
-
111
-
112
-
113
-
114
-
115
-
116
-
117
-
118
-
119
-
120
-
121
-
122
-
123
-
124
-
125
-
126
-
127
-
128
-
129
-
130
-
131
-
132
-
133
-
134
-
135
-
136
-
137
-
138
-
139
-
140
-
141
-
142
-
143
-
144
-
145
-
146
-
147
-
148
-
149
-
150
-
151
-
152
-
153
-
154
-
155
-
156
-
157
-
158
-
159
-
160
-
161
-
162
-
163
-
164
-
165
-
166
-
167
-
168
-
169
-
170
-
171
-
172
-
173
-
174
-
175
-
176
-
177
-
178
-
179
-
180
-
181
-
182
-
183
-
184
-
185
-
186
-
187
-
188
-
189
-
190
-
191
-
192
-
193
-
194
-
195
-
196
-
197
-
198
-
199
-
200
-
201
-
202
-
203
-
204
-
205
-
206
-
207
-
208
-
209
-
210
-
211
-
212
-
213
-
214
-
215
-
216
-
217
-
218
-
219
-
220
-
221
-
222
-
223
-
224
-
225
-
226
-
 227
227 -
 228
228 -
 229
229 -
 230
230 -
 231
231 -
 232
232 -
 233
233 -
 234
234 -
 235
235 -
 236
236 -
 237
237 -
 238
238 -
 239
239 -
 240
240 -
 241
241 -
 242
242 -
 243
243 -
 244
244 -
 245
245 -
 246
246 -
 247
247 -
248
-
249
-
250
-
251
-
252
-
253
-
254
-
255
-
256
-
257
-
258
-
259
-
260
-
261
-
262
-
263
-
264
-
265
-
266
-
267
-
268
-
269
-
270
-
271
-
272
-
273
-
274
-
275
-
276
-
277
-
278
-
279
-
280
-
281
-
282
-
283
-
284
 |
 |
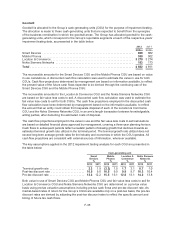
The discount rates applied in the impairment testing for each CGU have been determined
independently of capital structure reflecting current assessments of the time value of money and
relevant market risk premiums. Risk premiums included in the determination of the discount rate reflect
risks and uncertainties for which the future cash flow estimates have not been adjusted.
The recoverable amount of the Location & Commerce CGU exceeds its carrying amount by a small
margin in the fourth quarter 2012. The related valuation is deemed most sensitive to the changes in
both discount and long-term growth rates. A discount rate increase in excess of 0.5 percentage point or
long-term growth decline in excess of 1 percentage point would result in impairment loss in the
Location & Commerce CGU. Management’s estimates of the overall automotive volumes and market
share, customer adoption of the new location-based platform and related service offerings, projected
device sales volumes and fair value of the services sold within the Group as well as continued focus on
cost efficiency are the main drivers for the Location & Commerce net cash flow projections. The
Group’s cash flow forecasts reflect the current strategic views that license fee based models will
remain important in both near and long term. Management expects that license fee based models
which are augmented with software and services and monetized via license fees, transactions fees and
advertising, will grow in the future as more customers demand complete, end-to-end location solutions.
Actual short and long-term performance could vary from management’s forecasts and impact future
estimates of recoverable value. Since the recoverable amount exceeds the carrying amount only by a
small margin, any material adverse changes such as market deterioration or changes in the
competitive landscape could impact management’s estimates of the main drivers and result in
impairment loss.
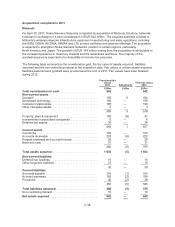
In the fourth quarter of 2011, the Group conducted annual impairment testing for the Location &
Commerce CGU to assess if events or changes in circumstances indicated that the carrying amount of
the Location & Commerce CGU was not recoverable. As a result, the Group recorded an impairment
loss of EUR 1 090 million to reduce the carrying amount of the Location & Commerce CGU to its
recoverable amount. The impairment loss was allocated in its entirety to the carrying amount of
goodwill in the balance sheet of the Location & Commerce CGU. This impairment loss is presented as
impairment of goodwill in the 2011 consolidated income statement. As a result of the impairment loss,
the amount of goodwill allocated to the Location & Commerce CGU was reduced to EUR 3 274 million
at December 31, 2011.
The impairment charge was result of an evaluation of the projected financial performance and net cash
flows of the Location & Commerce CGU. The main drivers for management’s net cash flow projections
included license fees related to digital map data, fair value of the services sold within the Group and
estimated average revenue per user with regard to mobile media advertising. The average revenue per
user was estimated based on peer market data for mobile advertising revenue. Projected device sales
volumes impacted the overall forecasted intercompany and advertising revenues. This took into
consideration the market dynamics in digital map data and related location-based content markets,
including the Group’s long-term view at the time of 2011 impairment testing, that the market will move
from fee-based models towards advertising-based models especially in some more mature markets. It
also reflected recent results and related competitive factors in local search and advertising markets
resulting in lower estimated growth prospects from location-based assets integrated with different
advertising platforms. After consideration of all relevant factors, the Group reduced the net sales
projections for the Location & Commerce CGU which, in turn, reduced projected profitability and cash
flows.
The Group’s goodwill impairment testing did not result in impairment charges for the years ended
December 31, 2012 or 2010. An impairment loss was recorded with respect to the Group’s Location &
Commerce CGU in 2011, as noted above. No further impairment charges were recorded with respect
to the other CGUs in 2011.
F-36