Nokia 2012 Annual Report Download - page 229
Download and view the complete annual report
Please find page 229 of the 2012 Nokia annual report below. You can navigate through the pages in the report by either clicking on the pages listed below, or by using the keyword search tool below to find specific information within the annual report.-
 1
1 -
2
-
3
-
4
-
5
-
6
-
7
-
8
-
9
-
10
-
11
-
12
-
13
-
14
-
15
-
16
-
17
-
18
-
19
-
20
-
21
-
22
-
23
-
24
-
25
-
26
-
27
-
28
-
29
-
30
-
31
-
32
-
33
-
34
-
35
-
36
-
37
-
38
-
39
-
40
-
41
-
42
-
43
-
44
-
45
-
46
-
47
-
48
-
49
-
50
-
51
-
52
-
53
-
54
-
55
-
56
-
57
-
58
-
59
-
60
-
61
-
62
-
63
-
64
-
65
-
66
-
67
-
68
-
69
-
70
-
71
-
72
-
73
-
74
-
75
-
76
-
77
-
78
-
79
-
80
-
81
-
82
-
83
-
84
-
85
-
86
-
87
-
88
-
89
-
90
-
91
-
92
-
93
-
94
-
95
-
96
-
97
-
98
-
99
-
100
-
101
-
102
-
103
-
104
-
105
-
106
-
107
-
108
-
109
-
110
-
111
-
112
-
113
-
114
-
115
-
116
-
117
-
118
-
119
-
120
-
121
-
122
-
123
-
124
-
125
-
126
-
127
-
128
-
129
-
130
-
131
-
132
-
133
-
134
-
135
-
136
-
137
-
138
-
139
-
140
-
141
-
142
-
143
-
144
-
145
-
146
-
147
-
148
-
149
-
150
-
151
-
152
-
153
-
154
-
155
-
156
-
157
-
158
-
159
-
160
-
161
-
162
-
163
-
164
-
165
-
166
-
167
-
168
-
169
-
170
-
171
-
172
-
173
-
174
-
175
-
176
-
177
-
178
-
179
-
180
-
181
-
182
-
183
-
184
-
185
-
186
-
187
-
188
-
189
-
190
-
191
-
192
-
193
-
194
-
195
-
196
-
197
-
198
-
199
-
200
-
201
-
202
-
203
-
204
-
205
-
206
-
207
-
208
-
209
-
210
-
211
-
212
-
213
-
214
-
215
-
216
-
217
-
218
-
 219
219 -
 220
220 -
 221
221 -
 222
222 -
 223
223 -
 224
224 -
 225
225 -
 226
226 -
 227
227 -
 228
228 -
 229
229 -
 230
230 -
 231
231 -
 232
232 -
 233
233 -
 234
234 -
 235
235 -
 236
236 -
 237
237 -
 238
238 -
 239
239 -
240
-
241
-
242
-
243
-
244
-
245
-
246
-
247
-
248
-
249
-
250
-
251
-
252
-
253
-
254
-
255
-
256
-
257
-
258
-
259
-
260
-
261
-
262
-
263
-
264
-
265
-
266
-
267
-
268
-
269
-
270
-
271
-
272
-
273
-
274
-
275
-
276
-
277
-
278
-
279
-
280
-
281
-
282
-
283
-
284
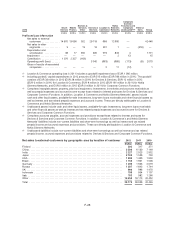
 |
 |

2010
Smart
Devices
Mobile
Phones
Devices &
Services
Other
Devices &
Services
Location &
Commerce
Nokia
Siemens
Networks
Corporate
Common
Functions and
Corporate
unallocated(4)(6)
Elimina-
tions Group
EURm EURm EURm EURm EURm EURm EURm EURm EURm
Profit and Loss Information
Net sales to external
customers .............. 14870 13696 552 29118 668 12660 — 42446
Net sales to other
segments ............... 3 — 13 16 201 1 — (218) —
Depreciation and
amortization ............ 38 17 350 405 519 843 4 1771
Impairment ............... — — — — — 2 13 15
Contribution .............. 1376 2327 (163)
Operating profit (loss) ...... 3540 (663) (686) (113) (8) 2 070
Share of results of associated
companies .............. — — — — 2 11 (12) 1
(1) Location & Commerce operating loss in 2011 includes a goodwill impairment loss of EUR 1 090 million.
(2) Including goodwill, capital expenditures in 2012 amount to EUR 515 million (EUR 786 million in 2011). The goodwill
consists of EUR 33 million in 2012 (EUR 28 million in 2011) for Devices & Services, EUR 12 million in 2012
(EUR 0 million in 2011) for Location & Commerce, EUR 9 million in 2012 (EUR 161 million in 2011) for Nokia
Siemens Networks, and EUR 0 million in 2012 (EUR 0 million in 2011) for Corporate Common Functions.
(3) Comprises intangible assets, property, plant and equipment, investments, inventories and accounts receivable as
well as prepaid expenses and accrued income except those related to interest and taxes for Devices & Services and
Corporate Common Functions. In addition, Location & Commerce and Nokia Siemens Networks’ assets include
cash and other liquid assets, available-for-sale investments, long-term loans receivable and other financial assets as
well as interest and tax related prepaid expenses and accrued income. These are directly attributable to Location &
Commerce and Nokia Siemens Networks.
(4) Unallocated assets include cash and other liquid assets, available-for-sale investments, long-term loans receivable
and other financial assets as well as interest and tax related prepaid expenses and accrued income for Devices &
Services and Corporate Common Functions.
(5) Comprises accounts payable, accrued expenses and provisions except those related to interest and taxes for
Devices & Services and Corporate Common Functions. In addition, Location & Commerce’s and Nokia Siemens
Networks’ liabilities include non-current liabilities and short-term borrowings as well as interest and tax related
prepaid income and accrued expenses and provisions. These are directly attributable to Location & Commerce and
Nokia Siemens Networks.
(6) Unallocated liabilities include non-current liabilities and short-term borrowings as well as interest and tax related
prepaid income, accrued expenses and provisions related to Devices & Services and Corporate Common Functions.
Net sales to external customers by geographic area by location of customer 2012 2011 2010
EURm EURm EURm
Finland ....................................................................... 303 317 371
China ......................................................................... 2 509 6 130 7 149
India ......................................................................... 2 227 2 923 2 952
Japan ........................................................................ 2 182 1 539 730
USA.......................................................................... 1 880 1 405 1 630
Brazil ......................................................................... 1 753 1 901 1 506
Germany ...................................................................... 1 299 1 606 2 019
Russia ........................................................................ 1 287 1 843 1 744
UK ........................................................................... 900 996 1 470
Indonesia ..................................................................... 799 904 1 157
Italy .......................................................................... 783 982 1 266
Other ......................................................................... 14 254 18 113 20 452
Total ......................................................................... 30 176 38 659 42 446
F-28