Nokia 2012 Annual Report Download - page 256
Download and view the complete annual report
Please find page 256 of the 2012 Nokia annual report below. You can navigate through the pages in the report by either clicking on the pages listed below, or by using the keyword search tool below to find specific information within the annual report.-
 1
1 -
2
-
3
-
4
-
5
-
6
-
7
-
8
-
9
-
10
-
11
-
12
-
13
-
14
-
15
-
16
-
17
-
18
-
19
-
20
-
21
-
22
-
23
-
24
-
25
-
26
-
27
-
28
-
29
-
30
-
31
-
32
-
33
-
34
-
35
-
36
-
37
-
38
-
39
-
40
-
41
-
42
-
43
-
44
-
45
-
46
-
47
-
48
-
49
-
50
-
51
-
52
-
53
-
54
-
55
-
56
-
57
-
58
-
59
-
60
-
61
-
62
-
63
-
64
-
65
-
66
-
67
-
68
-
69
-
70
-
71
-
72
-
73
-
74
-
75
-
76
-
77
-
78
-
79
-
80
-
81
-
82
-
83
-
84
-
85
-
86
-
87
-
88
-
89
-
90
-
91
-
92
-
93
-
94
-
95
-
96
-
97
-
98
-
99
-
100
-
101
-
102
-
103
-
104
-
105
-
106
-
107
-
108
-
109
-
110
-
111
-
112
-
113
-
114
-
115
-
116
-
117
-
118
-
119
-
120
-
121
-
122
-
123
-
124
-
125
-
126
-
127
-
128
-
129
-
130
-
131
-
132
-
133
-
134
-
135
-
136
-
137
-
138
-
139
-
140
-
141
-
142
-
143
-
144
-
145
-
146
-
147
-
148
-
149
-
150
-
151
-
152
-
153
-
154
-
155
-
156
-
157
-
158
-
159
-
160
-
161
-
162
-
163
-
164
-
165
-
166
-
167
-
168
-
169
-
170
-
171
-
172
-
173
-
174
-
175
-
176
-
177
-
178
-
179
-
180
-
181
-
182
-
183
-
184
-
185
-
186
-
187
-
188
-
189
-
190
-
191
-
192
-
193
-
194
-
195
-
196
-
197
-
198
-
199
-
200
-
201
-
202
-
203
-
204
-
205
-
206
-
207
-
208
-
209
-
210
-
211
-
212
-
213
-
214
-
215
-
216
-
217
-
218
-
219
-
220
-
221
-
222
-
223
-
224
-
225
-
226
-
227
-
228
-
229
-
230
-
231
-
232
-
233
-
234
-
235
-
236
-
237
-
238
-
239
-
240
-
241
-
242
-
243
-
244
-
245
-
 246
246 -
 247
247 -
 248
248 -
 249
249 -
 250
250 -
 251
251 -
 252
252 -
 253
253 -
 254
254 -
 255
255 -
 256
256 -
 257
257 -
 258
258 -
 259
259 -
 260
260 -
 261
261 -
 262
262 -
 263
263 -
 264
264 -
 265
265 -
 266
266 -
267
-
268
-
269
-
270
-
271
-
272
-
273
-
274
-
275
-
276
-
277
-
278
-
279
-
280
-
281
-
282
-
283
-
284
 |
 |

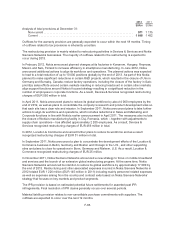
OMX Helsinki during the trading days of the first whole week of the second month of the respective
calendar quarter (i.e., February, May, August or November). With respect to the 2011 Stock Option
Plan, should an ex-dividend date take place during that week, the exercise price shall be determined
based on the following week’s trade volume weighted average price of the Nokia share on NASDAQ
OMX Helsinki. Exercise prices are determined on a one-week weighted average to mitigate any day-
specific fluctuations in Nokia’s share price. The determination of exercise price is defined in the terms
and conditions of the stock option plans, which were approved by the shareholders at the respective
Annual General Meetings 2007 and 2011. The Board of Directors does not have the right to change
how the exercise price is determined.
Shares will be eligible for dividend for the financial year in which the subscription takes place. Other
shareholder rights commence on the date on which the subscribed shares are entered in the Trade
Register. The stock option grants are generally forfeited if the employment relationship terminates with
Nokia.
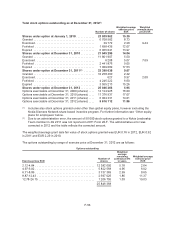
Pursuant to the stock options issued under the global stock option plans, an aggregate maximum
number of 25 721 002 new Nokia shares may be subscribed for, representing 0.7% of the total number
of votes at December 31, 2012. All share subscription prices based on the exercises of stock options
are recorded in the fund for invested non-restricted equity as per a resolution by the Annual General
Meeting.
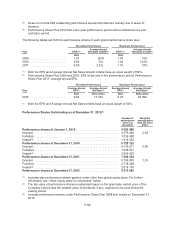
The table below sets forth certain information relating to the stock options outstanding at December 31,
2012.
Plan
(year of
launch)
Stock options
outstanding
2012
Number of
participants
(approx.)
Option
(sub) category
Vesting status
(as percentage
of total number
of stock options
outstanding)
Exercise period Exercise price/
share EURFirst vest date Last vest date Expiry date
2007(1) ... 7 579 015 2 400 2007 2Q Expired July 1, 2008 July 1, 2011 December 31, 2012 18.39
2007 3Q Expired October 1, 2008 October 1, 2011 December 31, 2012 21.86
2007 4Q Expired January 1, 2009 January 1, 2012 December 31, 2012 27.53
2008 1Q 100.00 April 1, 2009 April 1, 2012 December 31, 2013 24.15
2008 2Q 100.00 July 1, 2009 July 1, 2012 December 31, 2013 19.16
2008 3Q 100.00 October 1, 2009 October 1, 2012 December 31, 2013 17.80
2008 4Q 93.75 January 1, 2010 January 1, 2013 December 31, 2013 12.43
2009 1Q 87.50 April 1, 2010 April 1, 2013 December 31, 2014 9.82
2009 2Q 81.25 July 1, 2010 July 1, 2013 December 31, 2014 11.18
2009 3Q 75.00 October 1, 2010 October 1, 2013 December 31, 2014 9.28
2009 4Q 68.75 January 1, 2011 January 1, 2014 December 31, 2014 8.76
2010 1Q 62.50 April 1, 2011 April 1, 2014 December 31, 2015 10.11
2010 2Q 56.25 July 1, 2011 July 1, 2014 December 31, 2015 8.86
2010 3Q 50.00 October 1, 2011 October 1, 2014 December 31, 2015 7.29
2010 4Q 43.75 January 1, 2012 January 1, 2015 December 31, 2015 7.59
2011(2) ... 18 141 987 1 960 2011 2Q — July 1, 2014 July 1, 2015 December 27, 2017 6.02
2011 3Q — October 1, 2014 October 1, 2015 December 27, 2017 3.76
2011 4Q — January 1, 2015 January 1, 2016 December 27, 2017 4.84
2012 1Q — April 1, 2015 April 1, 2016 December 27, 2018 3.84
2012 2Q — July 1, 2015 July 1, 2016 December 27, 2018 2.44
2012 3Q — October 1, 2015 October 1, 2016 December 27, 2018 2.18
2012 4Q — January 1, 2016 January 1, 2017 December 27, 2018 2.12
(1) The Group’s global Stock Option Plan 2007 has a vesting schedule with a 25% vesting one year after grant, and quarterly vesting thereafter,
each of the quarterly lots representing 6.25% of the total grant. The grants vest fully in four years.
(2) The Group’s global Stock Option Plan 2011 has vesting schedule with 50% of stock options vesting three years after grant and the remaining
50% vesting four years from grant.
F-55