Nokia 2012 Annual Report Download - page 170
Download and view the complete annual report
Please find page 170 of the 2012 Nokia annual report below. You can navigate through the pages in the report by either clicking on the pages listed below, or by using the keyword search tool below to find specific information within the annual report.-
 1
1 -
2
-
3
-
4
-
5
-
6
-
7
-
8
-
9
-
10
-
11
-
12
-
13
-
14
-
15
-
16
-
17
-
18
-
19
-
20
-
21
-
22
-
23
-
24
-
25
-
26
-
27
-
28
-
29
-
30
-
31
-
32
-
33
-
34
-
35
-
36
-
37
-
38
-
39
-
40
-
41
-
42
-
43
-
44
-
45
-
46
-
47
-
48
-
49
-
50
-
51
-
52
-
53
-
54
-
55
-
56
-
57
-
58
-
59
-
60
-
61
-
62
-
63
-
64
-
65
-
66
-
67
-
68
-
69
-
70
-
71
-
72
-
73
-
74
-
75
-
76
-
77
-
78
-
79
-
80
-
81
-
82
-
83
-
84
-
85
-
86
-
87
-
88
-
89
-
90
-
91
-
92
-
93
-
94
-
95
-
96
-
97
-
98
-
99
-
100
-
101
-
102
-
103
-
104
-
105
-
106
-
107
-
108
-
109
-
110
-
111
-
112
-
113
-
114
-
115
-
116
-
117
-
118
-
119
-
120
-
121
-
122
-
123
-
124
-
125
-
126
-
127
-
128
-
129
-
130
-
131
-
132
-
133
-
134
-
135
-
136
-
137
-
138
-
139
-
140
-
141
-
142
-
143
-
144
-
145
-
146
-
147
-
148
-
149
-
150
-
151
-
152
-
153
-
154
-
155
-
156
-
157
-
158
-
159
-
 160
160 -
 161
161 -
 162
162 -
 163
163 -
 164
164 -
 165
165 -
 166
166 -
 167
167 -
 168
168 -
 169
169 -
 170
170 -
 171
171 -
 172
172 -
 173
173 -
 174
174 -
 175
175 -
 176
176 -
 177
177 -
 178
178 -
 179
179 -
 180
180 -
181
-
182
-
183
-
184
-
185
-
186
-
187
-
188
-
189
-
190
-
191
-
192
-
193
-
194
-
195
-
196
-
197
-
198
-
199
-
200
-
201
-
202
-
203
-
204
-
205
-
206
-
207
-
208
-
209
-
210
-
211
-
212
-
213
-
214
-
215
-
216
-
217
-
218
-
219
-
220
-
221
-
222
-
223
-
224
-
225
-
226
-
227
-
228
-
229
-
230
-
231
-
232
-
233
-
234
-
235
-
236
-
237
-
238
-
239
-
240
-
241
-
242
-
243
-
244
-
245
-
246
-
247
-
248
-
249
-
250
-
251
-
252
-
253
-
254
-
255
-
256
-
257
-
258
-
259
-
260
-
261
-
262
-
263
-
264
-
265
-
266
-
267
-
268
-
269
-
270
-
271
-
272
-
273
-
274
-
275
-
276
-
277
-
278
-
279
-
280
-
281
-
282
-
283
-
284
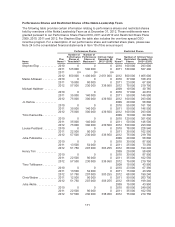
 |
 |

Stock
Option
Category
Expiration
Date
Exercise
Price
per
Share
(EUR)
Number of Stock
Options(1)
Total Intrinsic Value of
Stock Options,
December 28, 2012
(EUR)(2)
Name Exercisable Unexercisable Exercisable(3) Unexercisable
Timo Toikkanen .....2007 2Q December 31, 2012 18.39 0 0 0 0
2008 2Q December 31, 2013 19.16 10 000 0 0 0
2009 2Q December 31, 2014 11.18 9 750 2 250 0 0
2010 2Q December 31, 2015 8.86 14 060 10 940 0 0
2011 2Q December 27, 2017 6.02 0 27 000 0 0
2012 2Q December 27, 2018 2.44 0 28 500 0 13 965
2012 3Q December 27, 2018 2.18 0 75 000 0 56 250
Chris Weber ........2011 2Q December 27, 2017 6.02 0 25 000 0 0
2012 2Q December 27, 2018 2.44 0 40 000 0 19 600
2012 3Q December 27, 2018 2.18 0 63 500 0 47 625
Juha Äkräs .........2007 2Q December 31, 2012 18.39 0 0 0 0
2008 2Q December 31, 2013 19.16 6 000 0 0 0
2009 2Q December 31, 2014 11.18 9 750 2 250 0 0
2010 2Q December 31, 2015 8.86 22 500 17 500 0 0
2011 2Q December 27, 2017 6.02 0 45 000 0 0
2011 3Q December 27, 2017 3.76 0 150 000 0 0
2012 2Q December 27, 2018 2.44 0 115 000 0 56 350
Kai Öistämö ........2007 2Q December 31, 2012 18.39 0 0 0 0
2008 2Q December 31, 2013 19.16 32 000 0 0 0
2009 2Q December 31, 2014 11.18 48 750 11 250 0 0
2010 2Q December 31, 2015 8.86 39 375 30 625 0 0
2011 2Q December 27, 2017 6.02 0 45 000 0 0
2011 3Q December 27, 2017 3.76 0 150 000 0 0
2012 2Q December 27, 2018 2.44 0 90 000 0 44 100
Stock options held by
the members of the
Nokia Leadership
Team as at
December 31, 2012,
Total(5) ............ 658223 5028027 1035065
All outstanding stock
option plans (global
plans), Total ........ 5490746 20230256
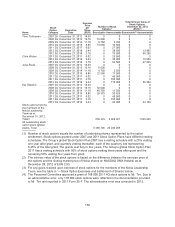
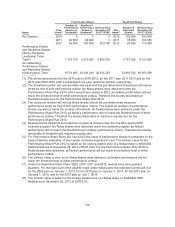
(1) Number of stock options equals the number of underlying shares represented by the option
entitlement. Stock options granted under 2007 and 2011 Stock Option Plans have different vesting
schedules. The Group’s global Stock Option Plan 2007 has a vesting schedule with a 25% vesting
one year after grant, and quarterly vesting thereafter, each of the quarterly lots representing
6.25% of the total grant. The grants vest fully in four years. The Group’s global Stock Option Plan
2011 has a vesting schedule with 50% of stock options vesting three years after grant and the
remaining 50% vesting four years from grant.
(2) The intrinsic value of the stock options is based on the difference between the exercise price of
the options and the closing market price of Nokia shares on NASDAQ OMX Helsinki as at
December 28, 2012 of EUR 2.93.
(3) For any gains realized upon exercise of stock options for the members of the Nokia Leadership
Team, see the table in “—Stock Option Exercises and Settlement of Shares” below.
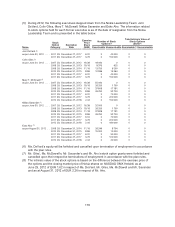
(4) The Personnel Committee approved a grant of 168 000 2011 4Q stock options to Mr. Tirri. Due to
an administrative error, only 118 000 stock options were reflected in the documentation provided
to Mr. Tirri and reported in 2011 Form 20-F. The administrative error was corrected in 2012.
169