Nokia 2012 Annual Report Download - page 110
Download and view the complete annual report
Please find page 110 of the 2012 Nokia annual report below. You can navigate through the pages in the report by either clicking on the pages listed below, or by using the keyword search tool below to find specific information within the annual report.-
 1
1 -
2
-
3
-
4
-
5
-
6
-
7
-
8
-
9
-
10
-
11
-
12
-
13
-
14
-
15
-
16
-
17
-
18
-
19
-
20
-
21
-
22
-
23
-
24
-
25
-
26
-
27
-
28
-
29
-
30
-
31
-
32
-
33
-
34
-
35
-
36
-
37
-
38
-
39
-
40
-
41
-
42
-
43
-
44
-
45
-
46
-
47
-
48
-
49
-
50
-
51
-
52
-
53
-
54
-
55
-
56
-
57
-
58
-
59
-
60
-
61
-
62
-
63
-
64
-
65
-
66
-
67
-
68
-
69
-
70
-
71
-
72
-
73
-
74
-
75
-
76
-
77
-
78
-
79
-
80
-
81
-
82
-
83
-
84
-
85
-
86
-
87
-
88
-
89
-
90
-
91
-
92
-
93
-
94
-
95
-
96
-
97
-
98
-
99
-
 100
100 -
 101
101 -
 102
102 -
 103
103 -
 104
104 -
 105
105 -
 106
106 -
 107
107 -
 108
108 -
 109
109 -
 110
110 -
 111
111 -
 112
112 -
 113
113 -
 114
114 -
 115
115 -
 116
116 -
 117
117 -
 118
118 -
 119
119 -
 120
120 -
121
-
122
-
123
-
124
-
125
-
126
-
127
-
128
-
129
-
130
-
131
-
132
-
133
-
134
-
135
-
136
-
137
-
138
-
139
-
140
-
141
-
142
-
143
-
144
-
145
-
146
-
147
-
148
-
149
-
150
-
151
-
152
-
153
-
154
-
155
-
156
-
157
-
158
-
159
-
160
-
161
-
162
-
163
-
164
-
165
-
166
-
167
-
168
-
169
-
170
-
171
-
172
-
173
-
174
-
175
-
176
-
177
-
178
-
179
-
180
-
181
-
182
-
183
-
184
-
185
-
186
-
187
-
188
-
189
-
190
-
191
-
192
-
193
-
194
-
195
-
196
-
197
-
198
-
199
-
200
-
201
-
202
-
203
-
204
-
205
-
206
-
207
-
208
-
209
-
210
-
211
-
212
-
213
-
214
-
215
-
216
-
217
-
218
-
219
-
220
-
221
-
222
-
223
-
224
-
225
-
226
-
227
-
228
-
229
-
230
-
231
-
232
-
233
-
234
-
235
-
236
-
237
-
238
-
239
-
240
-
241
-
242
-
243
-
244
-
245
-
246
-
247
-
248
-
249
-
250
-
251
-
252
-
253
-
254
-
255
-
256
-
257
-
258
-
259
-
260
-
261
-
262
-
263
-
264
-
265
-
266
-
267
-
268
-
269
-
270
-
271
-
272
-
273
-
274
-
275
-
276
-
277
-
278
-
279
-
280
-
281
-
282
-
283
-
284
 |
 |

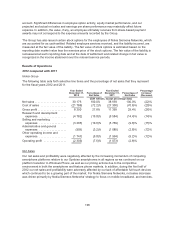
Results by Segments
Devices & Services
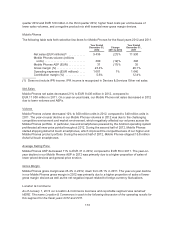
The following table sets forth selective line items and the percentage of net sales that they represent
for Devices & Services for the fiscal years 2012 and 2011.
Year Ended
December 31,
2012
Percentage of
Net Sales
Year Ended
December 31,
2011
Percentage of
Net Sales
Percentage
Increase/
(Decrease)
(EUR millions, except percentage data)
Net sales(1) ................... 15686 100.0% 23 943 100.0% (34)%
Cost of sales ................. (12340) (78.7)% (17 303) (72.3)% (29)%
Gross profit ................... 3346 21.3% 6 640 27.7% (50)%
Research and development
expenses .................. (1852) (11.8)% (2 441) (10.2)% (24)%
Selling and marketing
expenses .................. (1857) (11.8)% (2 180) (9.1)% (15)%
Administrative and general
expenses .................. (292) (1.9)% (362) (1.5)% (19)%
Other operating income and
expenses .................. (445) (2.8)% (773) (3.2)% (42)%
Operating profit ............... (1100) (7.0)% 884 3.7%
(1) Includes IPR income recognized in Devices & Services Other net sales.
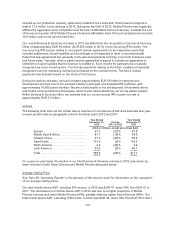
Net Sales
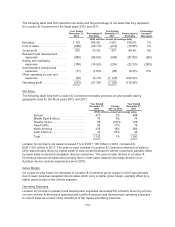
The following table sets forth our Devices & Services net sales and year-on-year growth rate by
geographic area for the fiscal years 2012 and 2011. The IPR income referred to in the paragraph
below has been allocated to the geographic area contained in this chart.
Year Ended
December 31,
2012
Change
2011 to 2012
Year Ended
December 31,
2011
(EUR millions, except percentage data)
Europe ........................... 4643 (34)% 7 064
Middle East & Africa ................ 2827 (31)% 4 098
Greater China ...................... 1610 (68)% 5 063
Asia-Pacific ........................ 3811 (22)% 4 896
North America ..................... 453 28% 354
Latin America ...................... 2342 (5)% 2 468
Total ............................. 15686 (34)% 23 943
The 34% year-on-year decline in Devices & Services net sales in 2012 resulted from lower volumes in
both Smart Devices and Mobile Phones as well as a lower ASP in Mobile Phones, partially offset by a
higher ASP in Smart Devices. Devices & Services Other net sales decreased in 2012 due to lower
non-recurring IPR income, the divestment of Vertu during the fourth quarter 2012 and lower spare
parts sales.
Smart Devices continued to transition as Symbian volumes decreased sequentially every quarter in
2012. Lumia device volumes grew in the first half of 2012 by expanding geographical distribution as
well as new product launches, but were negatively affected in the third quarter 2012 by product
transitions. In the fourth quarter 2012, Smart Devices net sales grew sequentially as we started
shipping new Lumia devices, although volumes were adversely affected by supply constraints as we
109