Nokia 2012 Annual Report Download - page 248
Download and view the complete annual report
Please find page 248 of the 2012 Nokia annual report below. You can navigate through the pages in the report by either clicking on the pages listed below, or by using the keyword search tool below to find specific information within the annual report.-
 1
1 -
2
-
3
-
4
-
5
-
6
-
7
-
8
-
9
-
10
-
11
-
12
-
13
-
14
-
15
-
16
-
17
-
18
-
19
-
20
-
21
-
22
-
23
-
24
-
25
-
26
-
27
-
28
-
29
-
30
-
31
-
32
-
33
-
34
-
35
-
36
-
37
-
38
-
39
-
40
-
41
-
42
-
43
-
44
-
45
-
46
-
47
-
48
-
49
-
50
-
51
-
52
-
53
-
54
-
55
-
56
-
57
-
58
-
59
-
60
-
61
-
62
-
63
-
64
-
65
-
66
-
67
-
68
-
69
-
70
-
71
-
72
-
73
-
74
-
75
-
76
-
77
-
78
-
79
-
80
-
81
-
82
-
83
-
84
-
85
-
86
-
87
-
88
-
89
-
90
-
91
-
92
-
93
-
94
-
95
-
96
-
97
-
98
-
99
-
100
-
101
-
102
-
103
-
104
-
105
-
106
-
107
-
108
-
109
-
110
-
111
-
112
-
113
-
114
-
115
-
116
-
117
-
118
-
119
-
120
-
121
-
122
-
123
-
124
-
125
-
126
-
127
-
128
-
129
-
130
-
131
-
132
-
133
-
134
-
135
-
136
-
137
-
138
-
139
-
140
-
141
-
142
-
143
-
144
-
145
-
146
-
147
-
148
-
149
-
150
-
151
-
152
-
153
-
154
-
155
-
156
-
157
-
158
-
159
-
160
-
161
-
162
-
163
-
164
-
165
-
166
-
167
-
168
-
169
-
170
-
171
-
172
-
173
-
174
-
175
-
176
-
177
-
178
-
179
-
180
-
181
-
182
-
183
-
184
-
185
-
186
-
187
-
188
-
189
-
190
-
191
-
192
-
193
-
194
-
195
-
196
-
197
-
198
-
199
-
200
-
201
-
202
-
203
-
204
-
205
-
206
-
207
-
208
-
209
-
210
-
211
-
212
-
213
-
214
-
215
-
216
-
217
-
218
-
219
-
220
-
221
-
222
-
223
-
224
-
225
-
226
-
227
-
228
-
229
-
230
-
231
-
232
-
233
-
234
-
235
-
236
-
237
-
 238
238 -
 239
239 -
 240
240 -
 241
241 -
 242
242 -
 243
243 -
 244
244 -
 245
245 -
 246
246 -
 247
247 -
 248
248 -
 249
249 -
 250
250 -
 251
251 -
 252
252 -
 253
253 -
 254
254 -
 255
255 -
 256
256 -
 257
257 -
 258
258 -
259
-
260
-
261
-
262
-
263
-
264
-
265
-
266
-
267
-
268
-
269
-
270
-
271
-
272
-
273
-
274
-
275
-
276
-
277
-
278
-
279
-
280
-
281
-
282
-
283
-
284
 |
 |

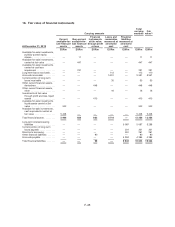
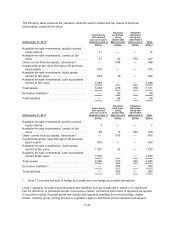
The following table presents the valuation methods used to determine fair values of financial
instruments carried at fair value:
At December 31, 2012
Instruments
with quoted
prices in active
markets (Level 1)
Valuation
technique
using
observable
data (Level 2)
Valuation
technique
using non-
observable
data (Level 3) Total
EURm EURm EURm EURm
Available-for-sale investments, publicly quoted
equity shares ............................. 11 — — 11
Available-for-sale investments, carried at fair
value ................................... 57 20 370 447
Other current financial assets, derivatives(1) ...... — 448 — 448
Investments at fair value through profit and loss,
liquid assets ............................. 415 — — 415
Available-for-sale investments, liquid assets
carried at fair value ........................ 532 10 — 542
Available for-sale investments, cash equivalents
carried at fair value ........................ 5448 — — 5448
Total assets ................................ 6463 478 370 7311
Derivative liabilities(1) ........................ — 90 — 90
Total liabilities .............................. — 90 — 90
At December 31, 2011
Instruments
with quoted
prices in active
markets (Level 1)
Valuation
technique
using
observable
data (Level 2)
Valuation
technique
using non-
observable
data (Level 3) Total
EURm EURm EURm EURm
Available-for-sale investments, publicly quoted
equity shares ............................. 7 — — 7
Available-for-sale investments, carried at fair
value ................................... 60 13 346 419
Other current financial assets, derivatives(1) ...... — 475 — 475
Investments at fair value through profit and loss,
liquid assets ............................. 433 — — 433
Available-for-sale investments, liquid assets
carried at fair value ........................ 1201 32 — 1233
Available for-sale investments, cash equivalents
carried at fair value ........................ 7279 — 7279
Total assets ................................ 8980 520 346 9846
Derivative liabilities(1) ........................ — 483 — 483
Total liabilities .............................. — 483 — 483
(1) Note 17 includes the split of hedge accounted and non-hedge accounted derivatives.
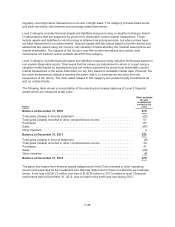
Level 1 category includes financial assets and liabilities that are measured in whole or in significant
part by reference to published quotes in an active market. A financial instrument is regarded as quoted
in an active market if quoted prices are readily and regularly available from an exchange, dealer,
broker, industry group, pricing service or regulatory agency and those prices represent actual and
F-47