Nokia 2012 Annual Report Download - page 273
Download and view the complete annual report
Please find page 273 of the 2012 Nokia annual report below. You can navigate through the pages in the report by either clicking on the pages listed below, or by using the keyword search tool below to find specific information within the annual report.-
 1
1 -
 2
2 -
 3
3 -
 4
4 -
 5
5 -
 6
6 -
 7
7 -
 8
8 -
 9
9 -
 10
10 -
 11
11 -
 12
12 -
 13
13 -
 14
14 -
 15
15 -
 16
16 -
 17
17 -
 18
18 -
 19
19 -
 20
20 -
 21
21 -
 22
22 -
 23
23 -
 24
24 -
 25
25 -
 26
26 -
 27
27 -
 28
28 -
 29
29 -
 30
30 -
 31
31 -
 32
32 -
 33
33 -
 34
34 -
 35
35 -
 36
36 -
 37
37 -
 38
38 -
 39
39 -
 40
40 -
 41
41 -
 42
42 -
 43
43 -
 44
44 -
 45
45 -
 46
46 -
 47
47 -
 48
48 -
 49
49 -
 50
50 -
 51
51 -
 52
52 -
 53
53 -
 54
54 -
 55
55 -
 56
56 -
 57
57 -
 58
58 -
 59
59 -
 60
60 -
 61
61 -
 62
62 -
 63
63 -
 64
64 -
 65
65 -
 66
66 -
 67
67 -
 68
68 -
 69
69 -
 70
70 -
 71
71 -
 72
72 -
 73
73 -
 74
74 -
 75
75 -
 76
76 -
 77
77 -
 78
78 -
 79
79 -
 80
80 -
 81
81 -
 82
82 -
 83
83 -
 84
84 -
 85
85 -
 86
86 -
 87
87 -
 88
88 -
 89
89 -
 90
90 -
 91
91 -
 92
92 -
 93
93 -
 94
94 -
 95
95 -
 96
96 -
 97
97 -
 98
98 -
 99
99 -
 100
100 -
 101
101 -
 102
102 -
 103
103 -
 104
104 -
 105
105 -
 106
106 -
 107
107 -
 108
108 -
 109
109 -
 110
110 -
 111
111 -
 112
112 -
 113
113 -
 114
114 -
 115
115 -
 116
116 -
 117
117 -
 118
118 -
 119
119 -
 120
120 -
 121
121 -
 122
122 -
 123
123 -
 124
124 -
 125
125 -
 126
126 -
 127
127 -
 128
128 -
 129
129 -
 130
130 -
 131
131 -
 132
132 -
 133
133 -
 134
134 -
 135
135 -
 136
136 -
 137
137 -
 138
138 -
 139
139 -
 140
140 -
 141
141 -
 142
142 -
 143
143 -
 144
144 -
 145
145 -
 146
146 -
 147
147 -
 148
148 -
 149
149 -
 150
150 -
 151
151 -
 152
152 -
 153
153 -
 154
154 -
 155
155 -
 156
156 -
 157
157 -
 158
158 -
 159
159 -
 160
160 -
 161
161 -
 162
162 -
 163
163 -
 164
164 -
 165
165 -
 166
166 -
 167
167 -
 168
168 -
 169
169 -
 170
170 -
 171
171 -
 172
172 -
 173
173 -
 174
174 -
 175
175 -
 176
176 -
 177
177 -
 178
178 -
 179
179 -
 180
180 -
 181
181 -
 182
182 -
 183
183 -
 184
184 -
 185
185 -
 186
186 -
 187
187 -
 188
188 -
 189
189 -
 190
190 -
 191
191 -
 192
192 -
 193
193 -
 194
194 -
 195
195 -
 196
196 -
 197
197 -
 198
198 -
 199
199 -
 200
200 -
 201
201 -
 202
202 -
 203
203 -
 204
204 -
 205
205 -
 206
206 -
 207
207 -
 208
208 -
 209
209 -
 210
210 -
 211
211 -
 212
212 -
 213
213 -
 214
214 -
 215
215 -
 216
216 -
 217
217 -
 218
218 -
 219
219 -
 220
220 -
 221
221 -
 222
222 -
 223
223 -
 224
224 -
 225
225 -
 226
226 -
 227
227 -
 228
228 -
 229
229 -
 230
230 -
 231
231 -
 232
232 -
 233
233 -
 234
234 -
 235
235 -
 236
236 -
 237
237 -
 238
238 -
 239
239 -
 240
240 -
 241
241 -
 242
242 -
 243
243 -
 244
244 -
 245
245 -
 246
246 -
 247
247 -
 248
248 -
 249
249 -
 250
250 -
 251
251 -
 252
252 -
 253
253 -
 254
254 -
 255
255 -
 256
256 -
 257
257 -
 258
258 -
 259
259 -
 260
260 -
 261
261 -
 262
262 -
 263
263 -
 264
264 -
 265
265 -
 266
266 -
 267
267 -
 268
268 -
 269
269 -
 270
270 -
 271
271 -
 272
272 -
 273
273 -
 274
274 -
 275
275 -
 276
276 -
 277
277 -
 278
278 -
 279
279 -
 280
280 -
 281
281 -
 282
282 -
 283
283 -
 284
284
 |
 |
Financial risks
The objective for Treasury activities in Nokia is to guarantee sufficient funding for the Group at all
times, and to identify, evaluate and manage financial risks. Treasury activities support this aim by
mitigating the adverse effects caused by fluctuations in the financial markets on the profitability of the
underlying businesses and by managing the capital structure of the Group by prudently balancing the
levels of liquid assets and financial borrowings.
Treasury activities are governed by the Treasury Policy approved by the CEO, that provides principles
for overall financial risk management and determines the allocation of responsibilities for financial risk
management in Nokia. Standard Operating Procedures approved by the CFO cover specific areas
such as foreign exchange risk, interest rate risk, credit and liquidity risk as well as use of derivative
financial instruments in managing these risks. Nokia is risk averse in its Treasury activities.
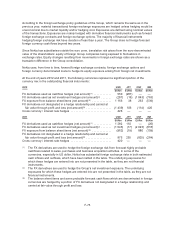
Financial risks are divided into (a) market risk (covering foreign exchange risk, interest risk and equity
price risk), (b) credit risk (covering business related credit risk and financial credit risk) and (c) liquidity
risk.
(a) Market Risk
Methodology for assessing market risk exposures: Value-at-Risk
Nokia uses the Value-at-Risk (VaR) methodology to assess the Group exposures to foreign exchange
(FX), interest rate, and equity risks. The VaR gives estimates of potential fair value losses in market
risk sensitive instruments as a result of adverse changes in specified market factors, at a specified
confidence level over a defined holding period.
In Nokia, the FX VaR is calculated with the Monte Carlo method which simulates random values for
exchange rates in which the Group has exposures and takes the non-linear price function of certain
FX derivative instruments into account. The variance-covariance methodology is used to assess and
measure the interest rate risk and equity price risk.
The VaR is determined by using volatilities and correlations of rates and prices estimated from a
one-year sample of historical market data, at 95% confidence level, using a one-month holding period.
To put more weight on recent market conditions, an exponentially weighted moving average is
performed on the data with an appropriate decay factor.
This model implies that within a one-month period, the potential loss will not exceed the VaR estimate
in 95% of possible outcomes. In the remaining 5% of possible outcomes, the potential loss will be at
minimum equal to the VaR figure, and on average substantially higher.
The VaR methodology relies on a number of assumptions, such as a) risks are measured under
average market conditions, assuming that market risk factors follow normal distributions; b) future
movements in market risk factors follow estimated historical movements; c) the assessed exposures
do not change during the holding period. Thus it is possible that, for any given month, the potential
losses at 95% confidence level are different and could be substantially higher than the estimated VaR.
Foreign exchange risk
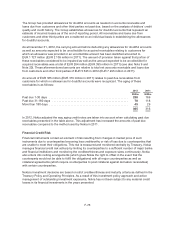
Nokia operates globally and is exposed to transactional and translational foreign exchange risks.
Transaction risk arises from foreign currency denominated assets and liabilities together with foreign
currency denominated future cash flows. Transaction exposures are managed in the context of various
functional currencies of foreign Group companies.
F-72
