Nokia 2012 Annual Report Download - page 111
Download and view the complete annual report
Please find page 111 of the 2012 Nokia annual report below. You can navigate through the pages in the report by either clicking on the pages listed below, or by using the keyword search tool below to find specific information within the annual report.-
 1
1 -
2
-
3
-
4
-
5
-
6
-
7
-
8
-
9
-
10
-
11
-
12
-
13
-
14
-
15
-
16
-
17
-
18
-
19
-
20
-
21
-
22
-
23
-
24
-
25
-
26
-
27
-
28
-
29
-
30
-
31
-
32
-
33
-
34
-
35
-
36
-
37
-
38
-
39
-
40
-
41
-
42
-
43
-
44
-
45
-
46
-
47
-
48
-
49
-
50
-
51
-
52
-
53
-
54
-
55
-
56
-
57
-
58
-
59
-
60
-
61
-
62
-
63
-
64
-
65
-
66
-
67
-
68
-
69
-
70
-
71
-
72
-
73
-
74
-
75
-
76
-
77
-
78
-
79
-
80
-
81
-
82
-
83
-
84
-
85
-
86
-
87
-
88
-
89
-
90
-
91
-
92
-
93
-
94
-
95
-
96
-
97
-
98
-
99
-
100
-
 101
101 -
 102
102 -
 103
103 -
 104
104 -
 105
105 -
 106
106 -
 107
107 -
 108
108 -
 109
109 -
 110
110 -
 111
111 -
 112
112 -
 113
113 -
 114
114 -
 115
115 -
 116
116 -
 117
117 -
 118
118 -
 119
119 -
 120
120 -
 121
121 -
122
-
123
-
124
-
125
-
126
-
127
-
128
-
129
-
130
-
131
-
132
-
133
-
134
-
135
-
136
-
137
-
138
-
139
-
140
-
141
-
142
-
143
-
144
-
145
-
146
-
147
-
148
-
149
-
150
-
151
-
152
-
153
-
154
-
155
-
156
-
157
-
158
-
159
-
160
-
161
-
162
-
163
-
164
-
165
-
166
-
167
-
168
-
169
-
170
-
171
-
172
-
173
-
174
-
175
-
176
-
177
-
178
-
179
-
180
-
181
-
182
-
183
-
184
-
185
-
186
-
187
-
188
-
189
-
190
-
191
-
192
-
193
-
194
-
195
-
196
-
197
-
198
-
199
-
200
-
201
-
202
-
203
-
204
-
205
-
206
-
207
-
208
-
209
-
210
-
211
-
212
-
213
-
214
-
215
-
216
-
217
-
218
-
219
-
220
-
221
-
222
-
223
-
224
-
225
-
226
-
227
-
228
-
229
-
230
-
231
-
232
-
233
-
234
-
235
-
236
-
237
-
238
-
239
-
240
-
241
-
242
-
243
-
244
-
245
-
246
-
247
-
248
-
249
-
250
-
251
-
252
-
253
-
254
-
255
-
256
-
257
-
258
-
259
-
260
-
261
-
262
-
263
-
264
-
265
-
266
-
267
-
268
-
269
-
270
-
271
-
272
-
273
-
274
-
275
-
276
-
277
-
278
-
279
-
280
-
281
-
282
-
283
-
284
 |
 |

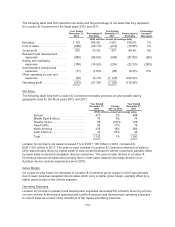
ramped up our production capacity, particularly related to the Lumia 920. Smart Devices shipped a
total of 13.4 million Lumia devices in 2012. During the first half of 2012, Mobile Phones was negatively
affected by aggressive price competition and the lack of affordable full touch devices. Towards the end
of the second quarter 2012 Mobile Phones introduced affordable Asha full touch smartphones and sold
15.8 million units in the second half 2012.
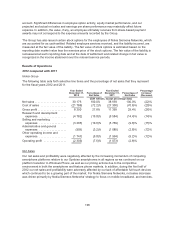
Our overall Devices & Services net sales in 2012 benefited from the recognition in Devices & Services
Other of approximately EUR 50 million (EUR 450 million in 2011) of non-recurring IPR income. The
non-recurring IPR income relates to new patent license agreements for the respective years that
included settlements of past royalties and accordingly is not expected to have a recurring benefit.
Patent license agreements are generally multi-year arrangements and may cover both licensee’s past
and future sales. Typically, when a patent license agreement is signed it includes an agreement or
settlement on past royalties that the licensor is entitled to. Such income for past periods is typically
recognized as a non-recurring item. The license payments relating to the future royalties are typically
recognized over the remaining contract period based on the contract terms. The future license
payments may fluctuate based on the terms of the license.
During the last two decades, we have invested approximately EUR 50 billion in research and
development and built one of the wireless industry’s strongest and broadest IPR portfolios, with
approximately 10 000 patent families. We are a world leader in the development of handheld device
and mobile communications technologies, which is also demonstrated by our strong patent position.
Within Devices & Services Other, we estimate that our current annual IPR income run-rate is
approximately EUR 0.5 billion.
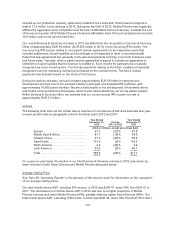
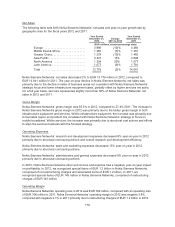
Volume
The following chart sets out the mobile device volumes for our Devices & Services business and year-
on-year growth rates by geographic area for the fiscal years 2012 and 2011.
Year Ended
December 31,
2012
Change
2011 to 2012
Year Ended
December 31,
2011
(Units in millions, except percentage data)
Europe ........................... 67.3 (23)% 87.8
Middle East & Africa ................ 81.7 (14)% 94.6
Greater China ...................... 27.5 (58)% 65.8
Asia-Pacific ........................ 113.5 (5)% 118.9
North America ..................... 2.2 (44)% 3.9
Latin America ...................... 43.4 (6)% 46.1
Total ............................. 335.6 (20)% 417.1
On a year-on-year basis, the decline in our total Devices & Services volumes in 2012 was driven by
lower volumes in both Smart Devices and Mobile Phones discussed below.
Average Selling Price
See “Item 5A. Operating Results” or the glossary of this annual report for information on the calculation
of our average selling prices.
Our total mobile device ASP, including IPR income, in 2012 was EUR 47, down 18% from EUR 57 in
2011. The decrease in our mobile device ASP in 2012 was due to a higher proportion of Mobile
Phones volumes and lower Mobile Phones ASPs, partially offset by higher Smart Devices ASPs. Our
total mobile device ASP, excluding IPR income, in 2012 was EUR 45, down 18% from EUR 55 in 2011.
110