Nokia 2012 Annual Report Download - page 153
Download and view the complete annual report
Please find page 153 of the 2012 Nokia annual report below. You can navigate through the pages in the report by either clicking on the pages listed below, or by using the keyword search tool below to find specific information within the annual report.-
 1
1 -
2
-
3
-
4
-
5
-
6
-
7
-
8
-
9
-
10
-
11
-
12
-
13
-
14
-
15
-
16
-
17
-
18
-
19
-
20
-
21
-
22
-
23
-
24
-
25
-
26
-
27
-
28
-
29
-
30
-
31
-
32
-
33
-
34
-
35
-
36
-
37
-
38
-
39
-
40
-
41
-
42
-
43
-
44
-
45
-
46
-
47
-
48
-
49
-
50
-
51
-
52
-
53
-
54
-
55
-
56
-
57
-
58
-
59
-
60
-
61
-
62
-
63
-
64
-
65
-
66
-
67
-
68
-
69
-
70
-
71
-
72
-
73
-
74
-
75
-
76
-
77
-
78
-
79
-
80
-
81
-
82
-
83
-
84
-
85
-
86
-
87
-
88
-
89
-
90
-
91
-
92
-
93
-
94
-
95
-
96
-
97
-
98
-
99
-
100
-
101
-
102
-
103
-
104
-
105
-
106
-
107
-
108
-
109
-
110
-
111
-
112
-
113
-
114
-
115
-
116
-
117
-
118
-
119
-
120
-
121
-
122
-
123
-
124
-
125
-
126
-
127
-
128
-
129
-
130
-
131
-
132
-
133
-
134
-
135
-
136
-
137
-
138
-
139
-
140
-
141
-
142
-
 143
143 -
 144
144 -
 145
145 -
 146
146 -
 147
147 -
 148
148 -
 149
149 -
 150
150 -
 151
151 -
 152
152 -
 153
153 -
 154
154 -
 155
155 -
 156
156 -
 157
157 -
 158
158 -
 159
159 -
 160
160 -
 161
161 -
 162
162 -
 163
163 -
164
-
165
-
166
-
167
-
168
-
169
-
170
-
171
-
172
-
173
-
174
-
175
-
176
-
177
-
178
-
179
-
180
-
181
-
182
-
183
-
184
-
185
-
186
-
187
-
188
-
189
-
190
-
191
-
192
-
193
-
194
-
195
-
196
-
197
-
198
-
199
-
200
-
201
-
202
-
203
-
204
-
205
-
206
-
207
-
208
-
209
-
210
-
211
-
212
-
213
-
214
-
215
-
216
-
217
-
218
-
219
-
220
-
221
-
222
-
223
-
224
-
225
-
226
-
227
-
228
-
229
-
230
-
231
-
232
-
233
-
234
-
235
-
236
-
237
-
238
-
239
-
240
-
241
-
242
-
243
-
244
-
245
-
246
-
247
-
248
-
249
-
250
-
251
-
252
-
253
-
254
-
255
-
256
-
257
-
258
-
259
-
260
-
261
-
262
-
263
-
264
-
265
-
266
-
267
-
268
-
269
-
270
-
271
-
272
-
273
-
274
-
275
-
276
-
277
-
278
-
279
-
280
-
281
-
282
-
283
-
284
 |
 |

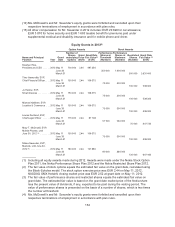
Summary Compensation Table 2012
Name and Principal
Position(1) Year
Salary
(EUR)
Bonus(2)
(EUR)
Stock
Awards(3)
(EUR)
Option
Awards(3)
(EUR)
Change in
Pension Value
and Nonqualified
Deferred
Compensation
Earnings(4)
(EUR)
All Other
Compensation
(EUR)
Total(5)
(EUR)
Stephen Elop,
President and CEO ........... 2012 1 079 500 0 2 631 400 497 350 56 776 69 395(6) 4 334 421
2011 1 020 000 473 070 3 752 396 539 443 73 956 2 085 948 7 944 813
2010 280 303 440 137 1 682 607 800 132 340 471 3 115 276 6 658 926
Timo Ihamuotila,
EVP, Chief Financial Officer . . . 2012 570 690 57 750 539 300 106 575 262 183 40 146(7) 1 576 644
2011 550 000 173 924 479 493 185 448 150 311 8 743 1 547 919
2010 423 524 245 634 1 341 568 166 328 31 933 8 893 2 217 880
Jo Harlow,
EVP, Smart Devices(8) ........2012 555 296 55 494 539 300 106 575 58 732(10) 1 315 397
Michael Halbherr,
EVP, Location & Commerce . . . 2012 411 531 44 038 539 300 106 575 61 477(11) 1 162 921
Louise Pentland,
EVP, Chief Legal Officer(8) .....2012 466 653 46 321 407 730 81 708 22 761(9)(12) 1 025 173
Mary T. McDowell,
EVP, Mobile Phones until
June 30, 2012(8)(14) ...........2012 659 335 0 539 300 106 575 265 566(9)(13) 1 570 777
2011 559 177 202 294 479 493 185 448 249 517 1 675 929
2010 559 637 314 782 1 233 368 142 567 71 386 2 321 740
Niklas Savander,
EVP, Markets until
June 30, 2012(14) .............2012 570 690 0 647 160 127 890 250 265 25 553(15) 1 621 558
2011 550 000 134 809 479 493 185 448 103 173 21 905 1 474 828
2010 441 943 247 086 1 233 368 142 567 23 634 2 088 598
(1) The positions set forth in this table are the current positions of the named executives.
Ms. McDowell served as Executive Vice President, Mobile Phones and Mr. Savander served as
Executive Vice President, Markets until June 30, 2012.
(2) The amount consists of the annual incentive cash bonus and/or other bonuses earned and paid or
payable by Nokia for the respective fiscal year. For fiscal year 2012, the annual incentive bonus
plan under the Nokia short-term cash incentive plan did not achieve established criteria; as a
result, there was no pay-out under that plan. The amount for year 2012 represents a discretionary
spot bonus awarded to certain Nokia Leadership Team members in recognition of their specific
contributions toward the progress made on our strategy as we headed into 2013.
(3) Amounts shown represent the grant date fair value of equity grants awarded for the respective
fiscal year. The fair value of stock options equals the estimated fair value on the grant date,
calculated using the Black-Scholes model.
The fair value of performance shares and restricted shares equals the estimated fair value on the
grant date. The estimated fair value is based on the grant date market price of a Nokia share less
the present value of dividends, if any, expected to be paid during the vesting period. The value of
the performance shares is presented on the basis of granted number of shares, which is two times
the number of shares at threshold.
The value of the stock awards with performance shares valued at maximum (four times the
number of shares at threshold), for each of the named executive officers, is as follows: Mr. Elop
EUR 3 542 800; Mr. Ihamuotila EUR 734 600; Ms. Harlow EUR 734 600; Mr. Halbherr
EUR 734 600; Ms. Pentland EUR 557 460; Ms. McDowell EUR 734 600; and Mr. Savander
EUR 881 520.
152