MoneyGram 2010 Annual Report Download - page 93
Download and view the complete annual report
Please find page 93 of the 2010 MoneyGram annual report below. You can navigate through the pages in the report by either clicking on the pages listed below, or by using the keyword search tool below to find specific information within the annual report.-
 1
1 -
2
-
3
-
4
-
5
-
6
-
7
-
8
-
9
-
10
-
11
-
12
-
13
-
14
-
15
-
16
-
17
-
18
-
19
-
20
-
21
-
22
-
23
-
24
-
25
-
26
-
27
-
28
-
29
-
30
-
31
-
32
-
33
-
34
-
35
-
36
-
37
-
38
-
39
-
40
-
41
-
42
-
43
-
44
-
45
-
46
-
47
-
48
-
49
-
50
-
51
-
52
-
53
-
54
-
55
-
56
-
57
-
58
-
59
-
60
-
61
-
62
-
63
-
64
-
65
-
66
-
67
-
68
-
69
-
70
-
71
-
72
-
73
-
74
-
75
-
76
-
77
-
78
-
79
-
80
-
81
-
82
-
 83
83 -
 84
84 -
 85
85 -
 86
86 -
 87
87 -
 88
88 -
 89
89 -
 90
90 -
 91
91 -
 92
92 -
 93
93 -
 94
94 -
 95
95 -
 96
96 -
 97
97 -
 98
98 -
 99
99 -
 100
100 -
 101
101 -
 102
102 -
 103
103 -
104
-
105
-
106
-
107
-
108
-
109
-
110
-
111
-
112
-
113
-
114
-
115
-
116
-
117
-
118
-
119
-
120
-
121
-
122
-
123
-
124
-
125
-
126
-
127
-
128
-
129
-
130
-
131
-
132
-
133
-
134
-
135
-
136
-
137
-
138
-
139
-
140
-
141
-
142
-
143
-
144
-
145
-
146
-
147
-
148
-
149
-
150
-
151
-
152
-
153
-
154
-
155
-
156
-
157
-
158
 |
 |

Table of Contents
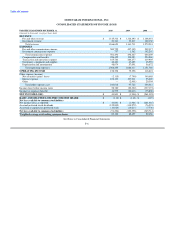
MONEYGRAM INTERNATIONAL, INC.
CONSOLIDATED STATEMENTS OF CASH FLOWS
FOR THE YEAR ENDED DECEMBER 31, 2010 2009 2008
(Amounts in thousands)
CASH FLOWS FROM OPERATING ACTIVITIES:
Net income (loss) $ 43,801 $ (1,906) $ (261,385)
Adjustments to reconcile net income (loss) to net cash provided by (used in)
operating activities:
Provision for deferred income taxes 10,023 (14,915) (425)
Depreciation and amortization 48,074 57,091 56,672
Other-than-temporary impairment charges 334 4,069 70,274
Net (gain) loss on sales and maturities of investments (2,449) (7,555) 256,299
Unrealized (gains) losses on trading investments and related put options — (4,304) 14,115
Net amortization of investment premiums and discounts 193 740 735
Valuation loss on embedded derivative — — 16,030
Asset impairments and adjustments 2,158 18,228 8,809
Signing bonus amortization 29,247 35,280 37,261
Signing bonus payments (27,172) (22,176) (57,960)
Amortization of debt discount and deferred financing costs 17,492 12,765 7,484
Debt extinguishment loss — — 1,499
Provision for uncollectible receivables 6,404 21,432 12,396
Non-cash compensation and pension expense 35,106 9,608 12,596
Other non-cash items, net 2,154 4,650 11,709
Change in foreign currency translation adjustments 232 (406) 3,039
Change in other assets (16,545) 31,246 (13,171)
Change in accounts payable and other liabilities (32,853) 13,156 (95,622)
Total adjustments 72,398 158,909 341,740
Change in cash and cash equivalents (substantially restricted) 510,883 700,557 (2,524,402)
Change in trading investments and related put options (substantially restricted) 29,400 32,900 —
Change in receivables, net (substantially restricted) 63,037 186,619 128,752
Change in payment service obligations (658,782) (594,545) (2,324,486)
Net cash provided by (used in) operating activities 60,737 482,534 (4,639,781)
CASH FLOWS FROM INVESTING ACTIVITIES:
Proceeds from sales of investments classified as available-for-sale (substantially restricted) — — 2,896,011
Proceeds from maturities of investments classified as available-for-sale (substantially restricted) 140,985 140,999 493,320
Purchase of short-term investments (substantially restricted) (707,137) (400,000) —
Proceeds from maturities of short-term investments (substantially restricted) 701,368 — —
Purchases of property and equipment (40,191) (37,948) (38,470)
Proceeds from disposal of property and equipment 7,537 — —
Proceeds from disposal of a business — 4,500 —
Cash paid for acquisitions, net of cash acquired (330) (3,210) (2,928)
Net cash provided by (used in) investing activities 102,232 (295,659) 3,347,933
CASH FLOWS FROM FINANCING ACTIVITIES:
Proceeds from issuance of debt — — 733,750
Transaction costs for issuance and amendment of debt — — (47,805)
Payments on debt (165,000) (41,875) (1,875)
Payments on revolving credit facility — (145,000) (100,000)
Proceeds from issuance of preferred stock — — 760,000
Transaction costs for issuance of preferred stock — — (52,222)
Proceeds from exercise of stock options 2,031 — —
Net cash (used in) provided by financing activities (162,969) (186,875) 1,291,848
NET CHANGE IN CASH AND CASH EQUIVALENTS — — —
CASH AND CASH EQUIVALENTS — Beginning of period $ — $ — $ —
CASH AND CASH EQUIVALENTS — End of period $ — $ — $ —
See Notes to Consolidated Financial Statements
F-8