MoneyGram 2010 Annual Report Download - page 48
Download and view the complete annual report
Please find page 48 of the 2010 MoneyGram annual report below. You can navigate through the pages in the report by either clicking on the pages listed below, or by using the keyword search tool below to find specific information within the annual report.-
 1
1 -
2
-
3
-
4
-
5
-
6
-
7
-
8
-
9
-
10
-
11
-
12
-
13
-
14
-
15
-
16
-
17
-
18
-
19
-
20
-
21
-
22
-
23
-
24
-
25
-
26
-
27
-
28
-
29
-
30
-
31
-
32
-
33
-
34
-
35
-
36
-
37
-
 38
38 -
 39
39 -
 40
40 -
 41
41 -
 42
42 -
 43
43 -
 44
44 -
 45
45 -
 46
46 -
 47
47 -
 48
48 -
 49
49 -
 50
50 -
 51
51 -
 52
52 -
 53
53 -
 54
54 -
 55
55 -
 56
56 -
 57
57 -
 58
58 -
59
-
60
-
61
-
62
-
63
-
64
-
65
-
66
-
67
-
68
-
69
-
70
-
71
-
72
-
73
-
74
-
75
-
76
-
77
-
78
-
79
-
80
-
81
-
82
-
83
-
84
-
85
-
86
-
87
-
88
-
89
-
90
-
91
-
92
-
93
-
94
-
95
-
96
-
97
-
98
-
99
-
100
-
101
-
102
-
103
-
104
-
105
-
106
-
107
-
108
-
109
-
110
-
111
-
112
-
113
-
114
-
115
-
116
-
117
-
118
-
119
-
120
-
121
-
122
-
123
-
124
-
125
-
126
-
127
-
128
-
129
-
130
-
131
-
132
-
133
-
134
-
135
-
136
-
137
-
138
-
139
-
140
-
141
-
142
-
143
-
144
-
145
-
146
-
147
-
148
-
149
-
150
-
151
-
152
-
153
-
154
-
155
-
156
-
157
-
158
 |
 |

Table of Contents
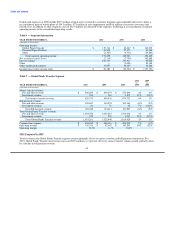
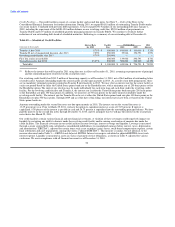
Money transfer fee and other revenue increased $35.8 million, or 4 percent, driven by transaction volume growth of 9 percent and
favorable corridor mix, partially offset by lower average money transfer fees from the introduction of the $50 price band in the United
States and the lower euro exchange rate. Money transfer transaction volume growth generated incremental revenue of $77.4 million,
while changes in corridor mix increased revenue another $2.4 million. Lower average money transfer fees decreased fee and other
revenue by $24.6 million, while the lower euro exchange rate decreased revenue by $18.1 million. In addition, money transfer fee and
other revenue in 2009 included $1.3 million of early termination fees.
Transactions and the related fee revenue are viewed as originating from the send side of a transaction. Accordingly, discussion of
transactions by geographic location refers to the region originating a transaction. Money transfer transactions originating outside of the
United States increased 15 percent over the prior year. Excluding Spain, transactions originating outside of the United States increased
18 percent over the prior year. Transactions sent from Spain decreased 4 percent for the full year, but increased in the fourth quarter of
2010 as compared to the fourth quarter of 2009. Money transfer transactions originating in the United States, excluding transactions sent
to Mexico, increased 8 percent due primarily to an 11 percent increase in intra-United States remittances. Transactions sent to Mexico
declined 2 percent from the impact of the United States recession on our consumers, but improved during the last half of the year. Mexico
represented approximately 9 percent of our total transactions in 2010, compared to approximately 10 percent in 2009.
Our money transfer agent base expanded 20 percent to approximately 227,000 locations in 2010, primarily due to expansion in markets
outside the United States. At December 31, 2010, the Americas had approximately 69,400 locations, with 40,000 locations in North
America and 29,400 locations in Latin America (including 13,500 locations in Mexico). At December 31, 2010, EMEAAP had
approximately 157,600 locations located in the following regions: 40,900 locations in Western Europe, 38,700 locations in Eastern
Europe, 36,200 locations in the Indian subcontinent, 25,700 locations in Asia Pacific, 12,300 locations in Africa and 3,800 locations in
the Middle East.
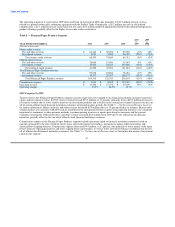
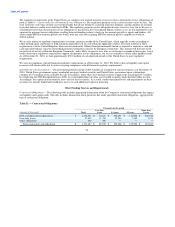
Bill payment fee and other revenue decreased $8.1 million, or 6 percent. Lower average fees from changes in industry mix and lower
volumes decreased revenue by $5.3 million and $2.8 million, respectively. Bill payment transaction volume decreased 1 percent,
reflecting a change in transaction mix as we continue to grow in new emerging verticals that generate lower revenue per transaction than
our traditional verticals. Due to economic conditions in the United States, volumes in our traditional verticals, such as auto and mortgage,
continue to be negatively impacted.
Commissions expense consists primarily of fees paid to our third-party agents for money transfer and bill payment services, as well as the
amortization of capitalized agent signing bonuses. In 2010, Global Funds Transfer commissions expense increased $8.5 million due
primarily to $23.7 million of incremental expense from money transfer volume growth, partially offset by a $7.4 million decrease from
the decline in the euro exchange rate and a $1.2 million decrease due to lower average money transfer commission rates. Bill payment
commissions expense decreased $2.9 million from lower volumes and lower average fees per transaction, partially offset by incremental
expense of $0.3 million from higher average commission rates related to biller incentives. Signing bonus expense decreased $2.9 million
as certain historical signing bonuses were fully amortized or written off in the prior year
The operating margin for the Global Funds Transfer segment increased to 13.2 percent in 2010 from 8.1 percent in 2009. Included in the
2010 operating margin is a $16.4 million benefit from a legal accrual reversal in 2010. In 2009, the operating margin included
$34.5 million of legal reserves related to a patent lawsuit and a settlement agreement with the Federal Trade Commission, an incremental
$15.0 million provision for loss in 2009 from the closure of an agent and a $3.2 million goodwill impairment charge related to a
discontinued bill payment product. After considering these items, the 2010 margin benefited from the money transfer volume growth,
partially offset by lower bill payment revenue.
45