MoneyGram 2010 Annual Report Download - page 51
Download and view the complete annual report
Please find page 51 of the 2010 MoneyGram annual report below. You can navigate through the pages in the report by either clicking on the pages listed below, or by using the keyword search tool below to find specific information within the annual report.-
 1
1 -
2
-
3
-
4
-
5
-
6
-
7
-
8
-
9
-
10
-
11
-
12
-
13
-
14
-
15
-
16
-
17
-
18
-
19
-
20
-
21
-
22
-
23
-
24
-
25
-
26
-
27
-
28
-
29
-
30
-
31
-
32
-
33
-
34
-
35
-
36
-
37
-
38
-
39
-
40
-
 41
41 -
 42
42 -
 43
43 -
 44
44 -
 45
45 -
 46
46 -
 47
47 -
 48
48 -
 49
49 -
 50
50 -
 51
51 -
 52
52 -
 53
53 -
 54
54 -
 55
55 -
 56
56 -
 57
57 -
 58
58 -
 59
59 -
 60
60 -
 61
61 -
62
-
63
-
64
-
65
-
66
-
67
-
68
-
69
-
70
-
71
-
72
-
73
-
74
-
75
-
76
-
77
-
78
-
79
-
80
-
81
-
82
-
83
-
84
-
85
-
86
-
87
-
88
-
89
-
90
-
91
-
92
-
93
-
94
-
95
-
96
-
97
-
98
-
99
-
100
-
101
-
102
-
103
-
104
-
105
-
106
-
107
-
108
-
109
-
110
-
111
-
112
-
113
-
114
-
115
-
116
-
117
-
118
-
119
-
120
-
121
-
122
-
123
-
124
-
125
-
126
-
127
-
128
-
129
-
130
-
131
-
132
-
133
-
134
-
135
-
136
-
137
-
138
-
139
-
140
-
141
-
142
-
143
-
144
-
145
-
146
-
147
-
148
-
149
-
150
-
151
-
152
-
153
-
154
-
155
-
156
-
157
-
158
 |
 |

Table of Contents
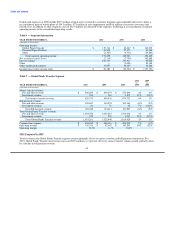
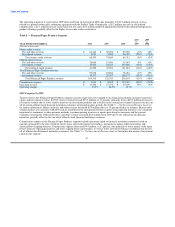
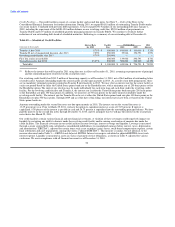
The operating margin for the Financial Paper Products segment increased to 33.3 percent in 2010 from 22.3 percent in 2009, reflecting
$6.1 million of goodwill and asset impairment charges in 2009 related to our money order business and lower commissions, partially
offset by lower investment revenue in 2010.
2009 Compared to 2008
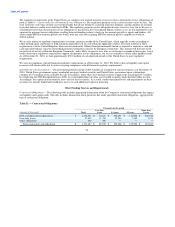
For 2009, Financial Paper Products total revenue decreased $115.4 million, or 48 percent, due primarily to a $130.4 million, or
81 percent, decrease in investment revenue from lower yields earned on our realigned investment portfolio and a decline in average
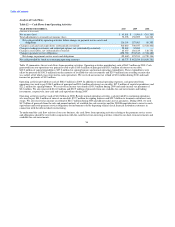
investment balances from the termination of certain official check financial institution customers. See Table 3 — Net Investment Revenue
Analysis for further information. This decrease was partially offset by a $15.0 million increase in fee and other revenue for money order
and official check products, primarily due to our repricing initiatives. During 2009, money order volumes declined 17 percent. This
decline is attributed to the anticipated attrition of agents due to the repricing initiative, consumer pricing increases as agents pass along
fee increases, the continued migration to other payment methods and the general economic environment.
Commissions expense decreased $102.0 million, or 92 percent, from 2008. Commissions expense for 2008 included a $27.7 million net
loss due to the termination of interest rate swaps related to the official check business. See Note 6 — Derivative Financial Instruments of
the Notes to Consolidated Financial Statements for further information. Investment commissions paid to financial institution customers
decreased in 2009 from the decline in the federal funds rate and lower investment balances upon which commissions were paid. See
Table 3 — Net Investment Revenue Analysis for further information.
The operating margin increased to 22.3 percent in 2009 from 12.7 percent in 2008, reflecting the growth in fee revenue from repricing
initiatives, the $27.7 million loss from the termination of swaps in 2008 and lower commissions expense from the decline in the federal
funds rate and lower investment balances.
Trends Expected to Impact 2011
The discussion of trends expected to impact our business in 2011 is based on information presently available and contains certain
assumptions regarding future economic conditions. Differences in actual economic conditions during 2011 compared with our
assumptions could have a material impact on our results. See "Cautionary Statements Regarding Forward-Looking Statements" and
Part I, Item 1A, Risk Factors of this Annual Report on Form 10-K for additional factors that could cause results to differ materially from
those contemplated by the following forward-looking statements.
Throughout 2010, global economic conditions remained weak. We cannot predict the duration or extent of the severity of these economic
conditions, nor the extent to which these conditions could negatively affect our business, operating results or financial condition. While
the money remittance industry has generally been resilient during times of economic softness, the current global economic conditions
have continued to adversely impact the demand for money remittances. Given the global economic uncertainty, we have less visibility to
the future and believe growth rates could continue to be impacted by slow economic conditions. In addition, bill payment products
available in the United States have not been as resilient as money transfers.
While there is uncertainty around the global economy and the remittance industry, the World Bank, a key source of industry analysis for
developing countries, is projecting five percent remittance growth in 2011. Our growth has historically exceeded the World Bank
projections. We expect our growth to be driven by agent expansion and increasing productivity in our existing agent locations through
marketing support, customer acquisition and new product innovation. We anticipate money transfer revenue growth to be lower than
transaction growth through the first quarter of 2011 due to the lower average fees resulting from the $50 price band that was introduced in
the first half of 2010. We anticipate that the $50 price band will be a long-term change in our pricing. We believe there is increased
competitive pressure in the remittance industry and although we have not seen significant pricing pressure outside of the $50 price band,
we will continue to proactively manage our pricing efforts. We believe all of these efforts will not only help to counteract the effects of
the current global economic conditions, but position us for enhanced market share and growth when the economy begins to recover.
48