MoneyGram 2010 Annual Report Download - page 50
Download and view the complete annual report
Please find page 50 of the 2010 MoneyGram annual report below. You can navigate through the pages in the report by either clicking on the pages listed below, or by using the keyword search tool below to find specific information within the annual report.-
 1
1 -
2
-
3
-
4
-
5
-
6
-
7
-
8
-
9
-
10
-
11
-
12
-
13
-
14
-
15
-
16
-
17
-
18
-
19
-
20
-
21
-
22
-
23
-
24
-
25
-
26
-
27
-
28
-
29
-
30
-
31
-
32
-
33
-
34
-
35
-
36
-
37
-
38
-
39
-
 40
40 -
 41
41 -
 42
42 -
 43
43 -
 44
44 -
 45
45 -
 46
46 -
 47
47 -
 48
48 -
 49
49 -
 50
50 -
 51
51 -
 52
52 -
 53
53 -
 54
54 -
 55
55 -
 56
56 -
 57
57 -
 58
58 -
 59
59 -
 60
60 -
61
-
62
-
63
-
64
-
65
-
66
-
67
-
68
-
69
-
70
-
71
-
72
-
73
-
74
-
75
-
76
-
77
-
78
-
79
-
80
-
81
-
82
-
83
-
84
-
85
-
86
-
87
-
88
-
89
-
90
-
91
-
92
-
93
-
94
-
95
-
96
-
97
-
98
-
99
-
100
-
101
-
102
-
103
-
104
-
105
-
106
-
107
-
108
-
109
-
110
-
111
-
112
-
113
-
114
-
115
-
116
-
117
-
118
-
119
-
120
-
121
-
122
-
123
-
124
-
125
-
126
-
127
-
128
-
129
-
130
-
131
-
132
-
133
-
134
-
135
-
136
-
137
-
138
-
139
-
140
-
141
-
142
-
143
-
144
-
145
-
146
-
147
-
148
-
149
-
150
-
151
-
152
-
153
-
154
-
155
-
156
-
157
-
158
 |
 |

Table of Contents
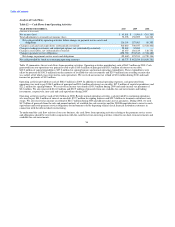
The operating margin of 8.1 percent for 2009 decreased from 14.0 percent in 2008, due primarily to $34.5 million of legal reserves
related to a patent lawsuit and a settlement agreement with the Federal Trade Commission, a $5.2 million increase in stock-based
compensation, a $7.1 million increase in provision for loss and a $3.2 million goodwill impairment related to discontinued bill payment
product offerings, partially offset by the higher fee revenue as discussed above.
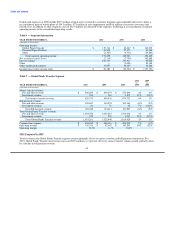
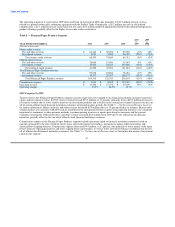
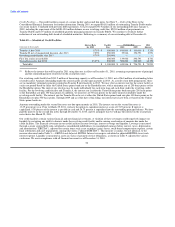
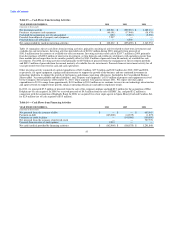
Table 8 — Financial Paper Products Segment
2010 2009
vs. vs.
YEAR ENDED DECEMBER 31, 2010 2009 2008 2009 2008
(Amounts in thousands)
Money order revenue:
Fee and other revenue $ 64,342 $ 69,296 $ 59,955 (7)% 16%
Investment revenue 3,951 5,584 26,357 (29)% (79)%
Total money order revenue 68,293 74,880 86,312 (9)% (13)%
Official check revenue:
Fee and other revenue 25,696 23,690 18,061 8% 31%
Investment revenue 15,526 24,213 133,820 (36)% (82)%
Total official check revenue 41,222 47,903 151,881 (14)% (68)%
Total Financial Paper Products revenue:
Fee and other revenue 90,038 92,986 78,016 (3)% 19%
Investment revenue 19,477 29,797 160,177 (35)% (81)%
Total Financial Paper Products revenue 109,515 122,783 238,193 (11)% (48)%
Commissions expense $ 3,931 $ 8,295 $ 110,310 (53)% (92)%
Operating income $ 36,508 $ 27,372 $ 30,169 33% (9)%
Operating margin 33.3% 22.3% 12.7%
2010 Compared to 2009
Total revenue in the Financial Paper Products segment consists of per-item fees charged to our financial institution customers and retail
agents and investment revenue. In 2010, total revenue decreased $13.3 million, or 11 percent, primarily from a $10.3 million decrease in
investment revenue due to lower yields earned on our investment portfolio and a decline in the average investment balances from the run-
off of certain official check financial institution customers terminated in prior periods. See Table 3 — Net Investment Revenue Analysis
for further information. Money order fee and other revenue decreased $5.0 million due to a 15 percent decline in volumes. Money order
volume declines are consistent with 2009 and are attributed to the anticipated attrition of agents from repricing initiatives, the continued
migration by consumers to other payment methods, consumer pricing increases as agents pass along fee increases and the general
economic environment. Official check fee and other revenue increased $2.0 million from 2009 due to our official check repricing
initiatives, partially offset by the run-off of official check financial institution customers.
Commissions expense in the Financial Paper Products segment includes payments made to financial institution customers based on
amounts generated by the sale of official checks times short-term interest rate indices, payments on money order transactions and
amortization of signing bonuses. Commissions expense decreased $4.4 million, or 53 percent, due primarily to lower money order agent
rebates from our repricing initiatives and lower signing bonus amortization, as well as lower investment balances resulting from the run-
off of official check financial institution customers. See Table 3 — Net Investment Revenue Analysis for further discussion of investment
commissions expense.
47