MoneyGram 2010 Annual Report Download - page 57
Download and view the complete annual report
Please find page 57 of the 2010 MoneyGram annual report below. You can navigate through the pages in the report by either clicking on the pages listed below, or by using the keyword search tool below to find specific information within the annual report.-
 1
1 -
2
-
3
-
4
-
5
-
6
-
7
-
8
-
9
-
10
-
11
-
12
-
13
-
14
-
15
-
16
-
17
-
18
-
19
-
20
-
21
-
22
-
23
-
24
-
25
-
26
-
27
-
28
-
29
-
30
-
31
-
32
-
33
-
34
-
35
-
36
-
37
-
38
-
39
-
40
-
41
-
42
-
43
-
44
-
45
-
46
-
 47
47 -
 48
48 -
 49
49 -
 50
50 -
 51
51 -
 52
52 -
 53
53 -
 54
54 -
 55
55 -
 56
56 -
 57
57 -
 58
58 -
 59
59 -
 60
60 -
 61
61 -
 62
62 -
 63
63 -
 64
64 -
 65
65 -
 66
66 -
 67
67 -
68
-
69
-
70
-
71
-
72
-
73
-
74
-
75
-
76
-
77
-
78
-
79
-
80
-
81
-
82
-
83
-
84
-
85
-
86
-
87
-
88
-
89
-
90
-
91
-
92
-
93
-
94
-
95
-
96
-
97
-
98
-
99
-
100
-
101
-
102
-
103
-
104
-
105
-
106
-
107
-
108
-
109
-
110
-
111
-
112
-
113
-
114
-
115
-
116
-
117
-
118
-
119
-
120
-
121
-
122
-
123
-
124
-
125
-
126
-
127
-
128
-
129
-
130
-
131
-
132
-
133
-
134
-
135
-
136
-
137
-
138
-
139
-
140
-
141
-
142
-
143
-
144
-
145
-
146
-
147
-
148
-
149
-
150
-
151
-
152
-
153
-
154
-
155
-
156
-
157
-
158
 |
 |

Table of Contents
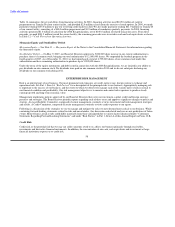
The regulatory requirements in the United States are similar to our internal measure of assets in excess of payment service obligations set
forth in Table 9 — Assets in Excess of Payment Service Obligations. The regulatory payment service assets measure varies by state. The
most restrictive states may exclude assets held at banks that do not belong to a national insurance program, varying amounts of accounts
receivable balances and/or assets held in the SPEs. The regulatory payment service obligation measure varies by state, but in all cases is
substantially lower than our payment service obligations as disclosed in the Consolidated Balance Sheets as we are not regulated by state
agencies for payment service obligations resulting from outstanding cashier's checks or for amounts payable to agents and brokers. All
states require MPSI to maintain positive net worth, with one state also requiring MPSI to maintain positive tangible net worth of
$100.0 million.
We are also subject to regulatory requirements in various countries outside of the United States, which typically results in needing to
either prefund agent settlements or hold minimum required levels of cash within the applicable country. The most material of these
requirements is in the United Kingdom, where our licensed entity, MoneyGram International Limited, is required to maintain a cash and
cash equivalent balance equal to outstanding payment instruments issued in the European community. This amount will fluctuate based
on our level of activity within the European Community, and is likely to increase over time as our business expands in that region. Assets
used to meet these regulatory requirements support our payment service obligations, but are not available to satisfy other liquidity needs.
As of December 31, 2010, we had approximately $50.2 million of cash deployed outside of the United States to meet regulatory
requirements.
We were in compliance with all financial regulatory requirements as of December 31, 2010. We believe that our liquidity and capital
resources will remain sufficient to ensure on-going compliance with all financial regulatory requirements.
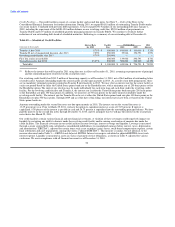
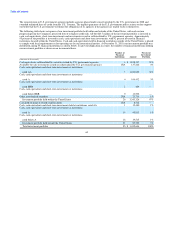
Available-for-sale Investments — Our investment portfolio includes $160.9 million of available-for-sale investments as of December 31,
2010. United States government agency residential mortgage-backed securities and United States government agency debentures
compose $137.2 million of our available-for-sale investments, while other asset-backed securities compose the remaining $23.7 million.
In completing our 2008 Recapitalization in 2008, we contemplated that our other asset-backed securities might decline further in value.
Accordingly, the capital raised assumed a zero value for these securities. As a result, further unrealized losses and impairments on these
securities are already funded and would not cause us to seek additional capital or financing.
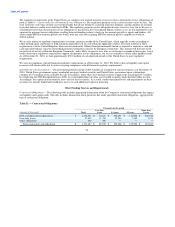
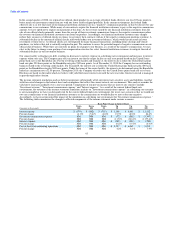
Other Funding Sources and Requirements
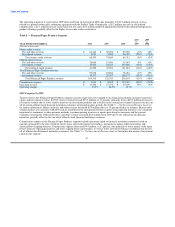
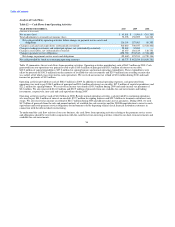
Contractual Obligations — The following table includes aggregated information about the Company's contractual obligations that impact
our liquidity and capital needs. The table includes information about payments due under specified contractual obligations, aggregated by
type of contractual obligation.
Table 11 — Contractual Obligations
Payments due by period
Less than More than
(Amounts in thousands) Total 1 year 1-3 years 4-5 years 5 years
Debt, including interest payments $ 1,143,444 $ 76,473 $ 286,328 $ 132,500 $ 648,142
Operating leases 47,683 11,782 22,940 7,482 5,479
Other obligations 300 300 — — —
Total contractual cash obligations $ 1,191,427 $ 88,555 $ 309,268 $ 139,982 $ 653,621
54