MoneyGram 2010 Annual Report Download - page 91
Download and view the complete annual report
Please find page 91 of the 2010 MoneyGram annual report below. You can navigate through the pages in the report by either clicking on the pages listed below, or by using the keyword search tool below to find specific information within the annual report.-
 1
1 -
2
-
3
-
4
-
5
-
6
-
7
-
8
-
9
-
10
-
11
-
12
-
13
-
14
-
15
-
16
-
17
-
18
-
19
-
20
-
21
-
22
-
23
-
24
-
25
-
26
-
27
-
28
-
29
-
30
-
31
-
32
-
33
-
34
-
35
-
36
-
37
-
38
-
39
-
40
-
41
-
42
-
43
-
44
-
45
-
46
-
47
-
48
-
49
-
50
-
51
-
52
-
53
-
54
-
55
-
56
-
57
-
58
-
59
-
60
-
61
-
62
-
63
-
64
-
65
-
66
-
67
-
68
-
69
-
70
-
71
-
72
-
73
-
74
-
75
-
76
-
77
-
78
-
79
-
80
-
 81
81 -
 82
82 -
 83
83 -
 84
84 -
 85
85 -
 86
86 -
 87
87 -
 88
88 -
 89
89 -
 90
90 -
 91
91 -
 92
92 -
 93
93 -
 94
94 -
 95
95 -
 96
96 -
 97
97 -
 98
98 -
 99
99 -
 100
100 -
 101
101 -
102
-
103
-
104
-
105
-
106
-
107
-
108
-
109
-
110
-
111
-
112
-
113
-
114
-
115
-
116
-
117
-
118
-
119
-
120
-
121
-
122
-
123
-
124
-
125
-
126
-
127
-
128
-
129
-
130
-
131
-
132
-
133
-
134
-
135
-
136
-
137
-
138
-
139
-
140
-
141
-
142
-
143
-
144
-
145
-
146
-
147
-
148
-
149
-
150
-
151
-
152
-
153
-
154
-
155
-
156
-
157
-
158
 |
 |
Table of Contents
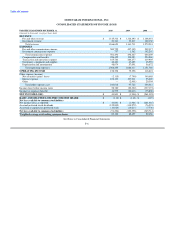
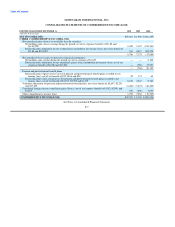
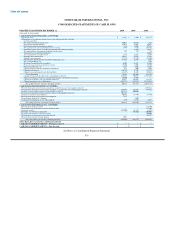
MONEYGRAM INTERNATIONAL, INC.
CONSOLIDATED STATEMENTS OF INCOME (LOSS)
FOR THE YEAR ENDED DECEMBER 31, 2010 2009 2008
(Amounts in thousands, except per share data)
REVENUE
Fee and other revenue $ 1,145,312 $ 1,128,492 $ 1,108,451
Investment revenue 21,341 33,219 162,130
Total revenue 1,166,653 1,161,711 1,270,581
EXPENSES
Fee and other commissions expense 500,759 497,105 502,317
Investment commissions expense 737 1,362 102,292
Total commissions expense 501,496 498,467 604,609
Compensation and benefits 226,422 199,053 224,580
Transaction and operations support 185,782 284,277 219,905
Occupancy, equipment and supplies 46,481 47,425 45,994
Depreciation and amortization 48,074 57,091 56,672
Total operating expenses 1,008,255 1,086,313 1,151,760
OPERATING INCOME 158,398 75,398 118,821
Other expense (income)
Net securities (gains) losses (2,115) (7,790) 340,688
Interest expense 102,133 107,911 95,020
Other — (2,401) 20,304
Total other expenses, net 100,018 97,720 456,012
Income (loss) before income taxes 58,380 (22,322) (337,191)
Income tax expense (benefit) 14,579 (20,416) (75,806)
NET INCOME(LOSS) $ 43,801 $ (1,906) $ (261,385)
BASIC AND DILUTED LOSS PER COMMON SHARE $ (1.10) $ (1.48) $ (4.19)
Net loss available to common stockholders:
Net income (loss) as reported $ 43,801 $ (1,906) $ (261,385)
Accrued preferred stock dividends (125,005) (110,279) (76,593)
Accretion recognized on preferred stock (10,020) (10,213) (7,736)
Net loss available to common stockholders (91,224) (122,398) (345,714)
Weighted-average outstanding common shares 83,186 82,499 82,456
See Notes to Consolidated Financial Statements
F-6