MoneyGram 2010 Annual Report Download - page 60
Download and view the complete annual report
Please find page 60 of the 2010 MoneyGram annual report below. You can navigate through the pages in the report by either clicking on the pages listed below, or by using the keyword search tool below to find specific information within the annual report.-
 1
1 -
2
-
3
-
4
-
5
-
6
-
7
-
8
-
9
-
10
-
11
-
12
-
13
-
14
-
15
-
16
-
17
-
18
-
19
-
20
-
21
-
22
-
23
-
24
-
25
-
26
-
27
-
28
-
29
-
30
-
31
-
32
-
33
-
34
-
35
-
36
-
37
-
38
-
39
-
40
-
41
-
42
-
43
-
44
-
45
-
46
-
47
-
48
-
49
-
 50
50 -
 51
51 -
 52
52 -
 53
53 -
 54
54 -
 55
55 -
 56
56 -
 57
57 -
 58
58 -
 59
59 -
 60
60 -
 61
61 -
 62
62 -
 63
63 -
 64
64 -
 65
65 -
 66
66 -
 67
67 -
 68
68 -
 69
69 -
 70
70 -
71
-
72
-
73
-
74
-
75
-
76
-
77
-
78
-
79
-
80
-
81
-
82
-
83
-
84
-
85
-
86
-
87
-
88
-
89
-
90
-
91
-
92
-
93
-
94
-
95
-
96
-
97
-
98
-
99
-
100
-
101
-
102
-
103
-
104
-
105
-
106
-
107
-
108
-
109
-
110
-
111
-
112
-
113
-
114
-
115
-
116
-
117
-
118
-
119
-
120
-
121
-
122
-
123
-
124
-
125
-
126
-
127
-
128
-
129
-
130
-
131
-
132
-
133
-
134
-
135
-
136
-
137
-
138
-
139
-
140
-
141
-
142
-
143
-
144
-
145
-
146
-
147
-
148
-
149
-
150
-
151
-
152
-
153
-
154
-
155
-
156
-
157
-
158
 |
 |

Table of Contents
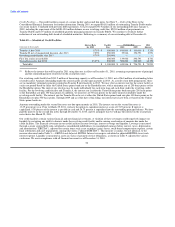
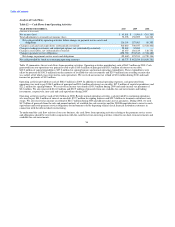
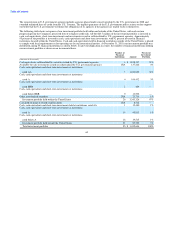
Table 13 — Cash Flows from Investing Activities
YEAR ENDED DECEMBER 31, 2010 2009 2008
(Amounts in thousands)
Net investment activity $ 135,216 $ (259,001) $ 3,389,331
Purchases of property and equipment (40,191) (37,948) (38,470)
Cash paid for acquisitions, net of cash acquired (330) (3,210) (2,928)
Proceeds from disposal of property and equipment 7,537 — —
Proceeds from sale of business — 4,500 —
Net cash provided by (used in) investing activities $ 102,232 $ (295,659) $ 3,347,933
Table 13 summarizes the net cash flows from investing activities, primarily consisting of activity related to short-term investments and
available-for-sale investments. Investing activities provided cash of $102.2 million during 2010, primarily from proceeds of
$141.0 million from the maturity of available-for-sale investments. Investing activities used cash of $295.7. million in 2009, primarily
from the purchase of $400.0 million of short-term investments, or time deposits and certificates of deposits with maturities greater than
three months but no longer than twelve months, partially offset by $141.0 million of proceeds from the maturity of available-for-sale
investments. For 2008, investing activities relate primarily to $2.9 billion of proceeds from the realignment of the investment portfolio
and $493.3 million of proceeds from the normal maturity of available-for-sale investments. Proceeds from net investment activity for all
years presented were reinvested in cash and cash equivalents.
Other investing activity consisted of capital expenditures of $40.2 million, $37.9 million and $38.5 million for 2010, 2009 and 2008,
respectively, for agent equipment, signage and infrastructure to support the growth of the business and our continued investment in
technology platforms to support the growth of the business and enhance operating efficiencies. Included in the Consolidated Balance
Sheets under "Accounts payable and other liabilities" and "Property and equipment" is $3.9 million of property and equipment received
by the Company, but not paid as of December 31, 2010. These amounts were paid in January 2011. We expect our total capital
expenditures in 2011 to range from approximately $43.0 million to $51.0 million as we continue to invest in our technology infrastructure
and agent network to support future growth, enhance operating efficiencies and address regulatory trends.
In 2010, we generated $7.5 million of proceeds from the sale of the corporate airplane and paid $0.3 million for the acquisition of Blue
Dolphin net of cash acquired. In 2009, we received proceeds of $4.5 million from the sale of FSMC, Inc. and paid $3.2 million in
connection with the acquisition of Raphaels Bank. In 2008, we acquired two of our super-agents in Spain, MoneyCard and Cambios Sol,
for $2.9 million (net of cash acquired of $5.5 million).
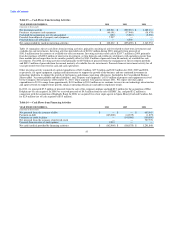
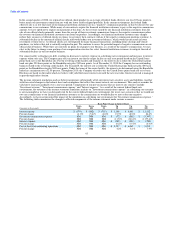
Table 14 — Cash Flows from Financing Activities
YEAR ENDED DECEMBER 31, 2010 2009 2008
(Amounts in thousands)
Net proceeds from the issuance of debt $ — $ — $ 685,945
Payment on debt (165,000) (41,875) (1,875)
Payments on credit facilities — (145,000) (100,000)
Net proceeds from the issuance of preferred stock — — 707,778
Proceeds from exercise of stock options 2,031 — —
Net cash (used in) provided by financing activities $ (162,969) $ (186,875) $ 1,291,848
57