MoneyGram 2010 Annual Report Download - page 138
Download and view the complete annual report
Please find page 138 of the 2010 MoneyGram annual report below. You can navigate through the pages in the report by either clicking on the pages listed below, or by using the keyword search tool below to find specific information within the annual report.-
 1
1 -
2
-
3
-
4
-
5
-
6
-
7
-
8
-
9
-
10
-
11
-
12
-
13
-
14
-
15
-
16
-
17
-
18
-
19
-
20
-
21
-
22
-
23
-
24
-
25
-
26
-
27
-
28
-
29
-
30
-
31
-
32
-
33
-
34
-
35
-
36
-
37
-
38
-
39
-
40
-
41
-
42
-
43
-
44
-
45
-
46
-
47
-
48
-
49
-
50
-
51
-
52
-
53
-
54
-
55
-
56
-
57
-
58
-
59
-
60
-
61
-
62
-
63
-
64
-
65
-
66
-
67
-
68
-
69
-
70
-
71
-
72
-
73
-
74
-
75
-
76
-
77
-
78
-
79
-
80
-
81
-
82
-
83
-
84
-
85
-
86
-
87
-
88
-
89
-
90
-
91
-
92
-
93
-
94
-
95
-
96
-
97
-
98
-
99
-
100
-
101
-
102
-
103
-
104
-
105
-
106
-
107
-
108
-
109
-
110
-
111
-
112
-
113
-
114
-
115
-
116
-
117
-
118
-
119
-
120
-
121
-
122
-
123
-
124
-
125
-
126
-
127
-
 128
128 -
 129
129 -
 130
130 -
 131
131 -
 132
132 -
 133
133 -
 134
134 -
 135
135 -
 136
136 -
 137
137 -
 138
138 -
 139
139 -
 140
140 -
 141
141 -
 142
142 -
 143
143 -
 144
144 -
 145
145 -
 146
146 -
 147
147 -
 148
148 -
149
-
150
-
151
-
152
-
153
-
154
-
155
-
156
-
157
-
158
 |
 |

Table of Contents
MONEYGRAM INTERNATIONAL, INC. AND SUBSIDIARIES
NOTES TO CONSOLIDATED FINANCIAL STATEMENTS — (Continued)
The Global Funds Transfer segment is managed as two geographical regions or operating segments, the Americas and EMEAAP, to
coordinate sales, agent management and marketing activities. The Americas region includes the United States, Canada, Mexico, the
Caribbean and Latin America. EMEAAP is composed of Europe, Middle East, Africa and the Asia Pacific region. The Company
monitor's performance and allocates resources at both a regional and reporting segment level. As the two regions routinely interact in
completing money transfer transactions and share systems, processes and licenses, we view the Global Funds Transfer segment as one
global network. The nature of the consumers and products offered is the same for each region, and the regions utilize the same agent
network, systems and support functions. In addition, the regions have similar regulatory requirements and economic characteristics.
Accordingly, we aggregate the two operating segments into one reporting segment.
Segment accounting policies are the same as those described in Note 2 — Summary of Significant Accounting Policies. The Company
manages its investment portfolio on a consolidated level, with no specific investment security assigned to a particular segment. However,
investment revenue is allocated to each segment based on the average investable balances generated by that segment's sale of payment
instruments during the period. Net securities (gains) losses are not allocated to the segments as the investment portfolio is managed at a
consolidated level. While the derivatives portfolio is also managed on a consolidated level, each derivative instrument is utilized in a
manner that can be identified to a particular segment. Interest rate swaps historically used to hedge variable rate commissions were
identified with the official check product in the Financial Paper Products segment, while forward foreign exchange contracts are
identified with the money transfer product in the Global Funds Transfer segment. Any interest rate swaps related to the Company's credit
agreements are not allocated to the segments.
Also excluded from operating income for Global Funds Transfer and Financial Paper Products are interest and other expenses related to
the Company's credit agreements, items related to the Company's preferred stock, operating income from businesses categorized as
"Other," certain pension and benefit obligation expenses, director deferred compensation plan expenses, executive severance and related
costs, certain legal and corporate costs not related to the performance of the segments and restructuring and reorganization costs.
Unallocated expenses in 2010 include $5.9 million of costs associated with restructuring initiatives and $1.8 million of asset impairments
in addition to other net corporate costs of $7.4 million not allocated to the segments. Unallocated expenses in 2009 include $20.3 million
of legal reserves related to securities litigation and stockholder derivative claims, a net curtailment gain on benefit plans of $14.3 million,
$7.0 million of asset impairments and $4.4 million of executive severance and related costs in addition to other net corporate costs of
$12.9 million not allocated to the segments.
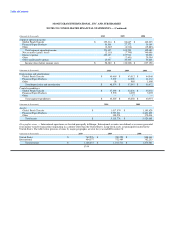
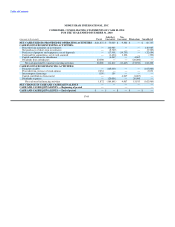
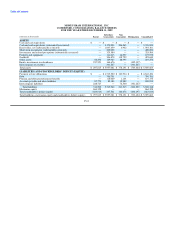
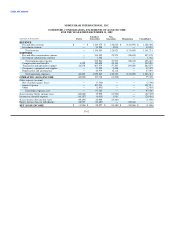
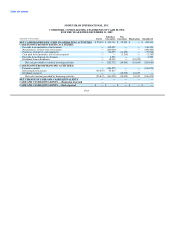
The following tables set forth operating results, depreciation and amortization, capital expenditures and assets by segment for the year
ended December 31:
(Amounts in thousands) 2010 2009 2008
Revenue
Global Funds Transfer:
Money transfer $ 926,733 $ 890,838 $ 874,722
Bill payment 126,548 134,611 141,207
Total Global Funds Transfer 1,053,281 1,025,449 1,015,929
Financial Paper Products:
Money order 68,293 74,880 86,312
Official check 41,222 47,903 151,881
Total Financial Paper Products 109,515 122,783 238,193
Other 3,857 13,479 16,459
Total revenue $ 1,166,653 $ 1,161,711 $ 1,270,581
F-53