MoneyGram 2010 Annual Report Download - page 111
Download and view the complete annual report
Please find page 111 of the 2010 MoneyGram annual report below. You can navigate through the pages in the report by either clicking on the pages listed below, or by using the keyword search tool below to find specific information within the annual report.-
 1
1 -
2
-
3
-
4
-
5
-
6
-
7
-
8
-
9
-
10
-
11
-
12
-
13
-
14
-
15
-
16
-
17
-
18
-
19
-
20
-
21
-
22
-
23
-
24
-
25
-
26
-
27
-
28
-
29
-
30
-
31
-
32
-
33
-
34
-
35
-
36
-
37
-
38
-
39
-
40
-
41
-
42
-
43
-
44
-
45
-
46
-
47
-
48
-
49
-
50
-
51
-
52
-
53
-
54
-
55
-
56
-
57
-
58
-
59
-
60
-
61
-
62
-
63
-
64
-
65
-
66
-
67
-
68
-
69
-
70
-
71
-
72
-
73
-
74
-
75
-
76
-
77
-
78
-
79
-
80
-
81
-
82
-
83
-
84
-
85
-
86
-
87
-
88
-
89
-
90
-
91
-
92
-
93
-
94
-
95
-
96
-
97
-
98
-
99
-
100
-
 101
101 -
 102
102 -
 103
103 -
 104
104 -
 105
105 -
 106
106 -
 107
107 -
 108
108 -
 109
109 -
 110
110 -
 111
111 -
 112
112 -
 113
113 -
 114
114 -
 115
115 -
 116
116 -
 117
117 -
 118
118 -
 119
119 -
 120
120 -
 121
121 -
122
-
123
-
124
-
125
-
126
-
127
-
128
-
129
-
130
-
131
-
132
-
133
-
134
-
135
-
136
-
137
-
138
-
139
-
140
-
141
-
142
-
143
-
144
-
145
-
146
-
147
-
148
-
149
-
150
-
151
-
152
-
153
-
154
-
155
-
156
-
157
-
158
 |
 |

Table of Contents
MONEYGRAM INTERNATIONAL, INC. AND SUBSIDIARIES
NOTES TO CONSOLIDATED FINANCIAL STATEMENTS — (Continued)
The Company realigned its investment portfolio during the first quarter of 2008, resulting in the sale of securities with a fair value of
$3.2 billion (after other-than-temporary impairment charges) for proceeds of $2.9 billion and a net realized loss of $256.3 million. The
net realized loss was the result of further deterioration in the markets during the first quarter of 2008 and the short timeframe over which
the Company sold its securities. Proceeds from the sales were reinvested in cash and cash equivalents to supplement the Company's assets
in excess of payment service obligations. Other-than-temporary impairment charges of $70.3 million during 2008 were the result of
further deterioration in the markets. The Company continues to have the intent to sell its investments classified as Other asset-backed
securities.
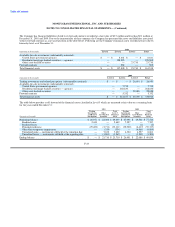
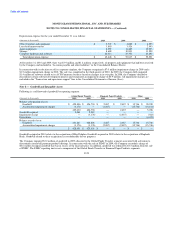
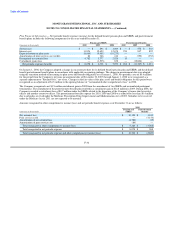
Investment Ratings — In rating the securities in its investment portfolio, the Company uses ratings from Moody's Investor Service
("Moody's"), Standard & Poors ("S&P") and Fitch Ratings ("Fitch"). If the rating agencies have split ratings, the Company uses the
highest rating across the rating agencies for disclosure purposes. Securities issued or backed by United States government agencies are
included in the AAA rating category. Investment grade is defined as a security having a Moody's equivalent rating of Aaa, Aa, A or Baa
or an S&P or Fitch equivalent rating of AAA, AA, A or BBB. The Company's investments at December 31 consisted of the following
ratings:
2010 2009
Number of Fair Percent of Number of Fair Percent of
(Dollars in thousands) Securities Value Investments Securities Value Investments
AAA, including United States agencies 25 $ 136,893 85% 34 $ 276,215 92%
A 0 — — 1 415 0%
BBB 0 — — 1 1,842 1%
Below investment grade 64 24,043 15% 69 20,161 7%
Total 89 $ 160,936 100% 105 $ 298,633 100%
Had the Company used the lowest rating from the rating agencies in the information presented above, there would be no change to
investments rated A or better as of December 31, 2010 and 2009.
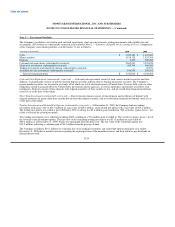
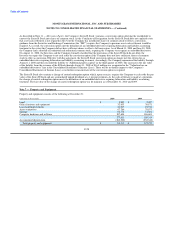
Contractual Maturities — The amortized cost and fair value of available-for-sale securities at December 31, by contractual maturity, are
shown below. Actual maturities may differ from contractual maturities as borrowers may have the right to call or prepay obligations,
sometimes without call or prepayment penalties. Maturities of mortgage-backed and other asset-backed securities depend on the
repayment characteristics and experience of the underlying obligations.
2010 2009
Amortized Fair Amortized Fair
(Amounts in thousands) Cost Value Cost Value
After one year through five years $ 7,273 $ 8,641 $ 6,854 $ 7,715
Mortgage-backed and other asset-backed securities 132,367 152,295 275,269 290,918
Total $ 139,640 $ 160,936 $ 282,123 $ 298,633
Fair Value Determination — The Company uses various sources of pricing for its fair value estimates of its available-for-sale portfolio.
The percentage of the portfolio for which the various pricing sources were used is as follows at December 31, 2010 and 2009: 81 percent
and 91 percent, respectively, used a third party pricing service; 6 percent and 4 percent, respectively, used broker pricing; and 13 percent
and 5 percent, respectively, used internal pricing.
Assessment of Unrealized Losses — At December 31, 2010 and 2009, the Company had nominal unrealized losses in its available-for-sale
portfolio, with one Residential mortgage-backed agency security in an unrealized loss position aged 12 months or more, after the
recognition of other-than-temporary impairment charges.
F-26