MoneyGram 2010 Annual Report Download - page 45
Download and view the complete annual report
Please find page 45 of the 2010 MoneyGram annual report below. You can navigate through the pages in the report by either clicking on the pages listed below, or by using the keyword search tool below to find specific information within the annual report.-
 1
1 -
2
-
3
-
4
-
5
-
6
-
7
-
8
-
9
-
10
-
11
-
12
-
13
-
14
-
15
-
16
-
17
-
18
-
19
-
20
-
21
-
22
-
23
-
24
-
25
-
26
-
27
-
28
-
29
-
30
-
31
-
32
-
33
-
34
-
 35
35 -
 36
36 -
 37
37 -
 38
38 -
 39
39 -
 40
40 -
 41
41 -
 42
42 -
 43
43 -
 44
44 -
 45
45 -
 46
46 -
 47
47 -
 48
48 -
 49
49 -
 50
50 -
 51
51 -
 52
52 -
 53
53 -
 54
54 -
 55
55 -
56
-
57
-
58
-
59
-
60
-
61
-
62
-
63
-
64
-
65
-
66
-
67
-
68
-
69
-
70
-
71
-
72
-
73
-
74
-
75
-
76
-
77
-
78
-
79
-
80
-
81
-
82
-
83
-
84
-
85
-
86
-
87
-
88
-
89
-
90
-
91
-
92
-
93
-
94
-
95
-
96
-
97
-
98
-
99
-
100
-
101
-
102
-
103
-
104
-
105
-
106
-
107
-
108
-
109
-
110
-
111
-
112
-
113
-
114
-
115
-
116
-
117
-
118
-
119
-
120
-
121
-
122
-
123
-
124
-
125
-
126
-
127
-
128
-
129
-
130
-
131
-
132
-
133
-
134
-
135
-
136
-
137
-
138
-
139
-
140
-
141
-
142
-
143
-
144
-
145
-
146
-
147
-
148
-
149
-
150
-
151
-
152
-
153
-
154
-
155
-
156
-
157
-
158
 |
 |
Table of Contents
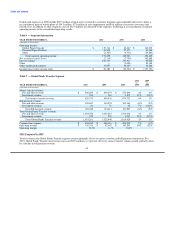
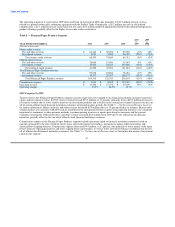
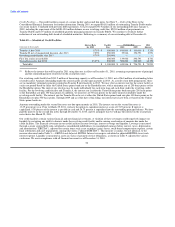
Although we believe the EBITDA and Adjusted EBITDA enhance investors' understanding of our business and performance, these non-
GAAP financial measures should not be considered an exclusive alternative to accompanying GAAP financial measures. The following
table is a reconciliation of these non-GAAP financial measures to the related GAAP financial measures.
Table 5 — EBITDA and Adjusted EBITDA
YEAR ENDED DECEMBER 31, 2010 2009 2008
(Amounts in thousands)
Income (loss) before income taxes $ 58,380 $ (22,322) $ (337,191)
Interest expense 102,133 107,911 95,020
Depreciation and amortization 48,074 57,091 56,672
Amortization of agent signing bonuses 29,247 35,280 37,261
EBITDA 237,834 177,960 (148,238)
Significant items impacting EBITDA:
Net securities (gains) losses (2,115) (7,790) 340,688
Gain on security previously priced at zero — — (10,456)
Severance and related costs (346) 4,353 16,653
Restructuring and reorganization costs 5,853 — —
Asset impairment charges 1,829 18,329 8,809
Stock-based compensation expense 26,011 14,152 3,691
Net curtailment (gain) loss on benefit plans — (14,339) 1,000
Legal accruals (14,572) 54,750 —
Valuation loss on embedded derivatives — — 16,030
Transaction costs related to the 2008 Recapitalization — — 7,733
Debt extinguishment loss — — 1,499
Valuation loss on interest rate swaps 27,735
Adjusted EBITDA $ 254,494 $ 247,415 $ 265,144
For 2010, EBITDA increased $59.9 million, or 34 percent, to $237.8 million from $178.0 million in 2009, reflecting lower legal accruals
and asset impairment charges and the benefits of cost savings initiatives, partially offset by higher stock-based compensation and a net
curtailment gain recorded in 2009. Adjusted EBITDA for 2010 increased $7.1 million, or 3 percent, to $254.5 million from
$247.4 million in 2009, primarily due to money transfer growth and cost savings initiatives.
For 2009, EBITDA increased $326.2 million to $178.0 million as compared to negative EBITDA of $148.2 million in 2008. EBITDA in
2008 was negatively impacted by $340.1 million of net securities losses incurred during the realignment of our investment portfolio and
the continued credit market deterioration, valuation losses on embedded derivatives and interest rate swaps, expenses related to our 2008
Recapitalization and executive severance and related costs. EBITDA in 2009 was negatively impacted by $54.8 million of legal accruals,
higher stock-based compensation and asset impairment charges, partially offset by a $14.3 million net curtailment gain on benefit plans.
Adjusted EBITDA for 2009 decreased $17.7 million, or 7 percent, to $247.4 million from $265.1 million in 2008, primarily due to lower
investment revenue from the realignment of our investment portfolio and the run-off of investment balances from the official check
restructuring, partially offset by money transfer growth.
42