MoneyGram 2010 Annual Report Download - page 32
Download and view the complete annual report
Please find page 32 of the 2010 MoneyGram annual report below. You can navigate through the pages in the report by either clicking on the pages listed below, or by using the keyword search tool below to find specific information within the annual report.-
 1
1 -
2
-
3
-
4
-
5
-
6
-
7
-
8
-
9
-
10
-
11
-
12
-
13
-
14
-
15
-
16
-
17
-
18
-
19
-
20
-
21
-
 22
22 -
 23
23 -
 24
24 -
 25
25 -
 26
26 -
 27
27 -
 28
28 -
 29
29 -
 30
30 -
 31
31 -
 32
32 -
 33
33 -
 34
34 -
 35
35 -
 36
36 -
 37
37 -
 38
38 -
 39
39 -
 40
40 -
 41
41 -
 42
42 -
43
-
44
-
45
-
46
-
47
-
48
-
49
-
50
-
51
-
52
-
53
-
54
-
55
-
56
-
57
-
58
-
59
-
60
-
61
-
62
-
63
-
64
-
65
-
66
-
67
-
68
-
69
-
70
-
71
-
72
-
73
-
74
-
75
-
76
-
77
-
78
-
79
-
80
-
81
-
82
-
83
-
84
-
85
-
86
-
87
-
88
-
89
-
90
-
91
-
92
-
93
-
94
-
95
-
96
-
97
-
98
-
99
-
100
-
101
-
102
-
103
-
104
-
105
-
106
-
107
-
108
-
109
-
110
-
111
-
112
-
113
-
114
-
115
-
116
-
117
-
118
-
119
-
120
-
121
-
122
-
123
-
124
-
125
-
126
-
127
-
128
-
129
-
130
-
131
-
132
-
133
-
134
-
135
-
136
-
137
-
138
-
139
-
140
-
141
-
142
-
143
-
144
-
145
-
146
-
147
-
148
-
149
-
150
-
151
-
152
-
153
-
154
-
155
-
156
-
157
-
158
 |
 |
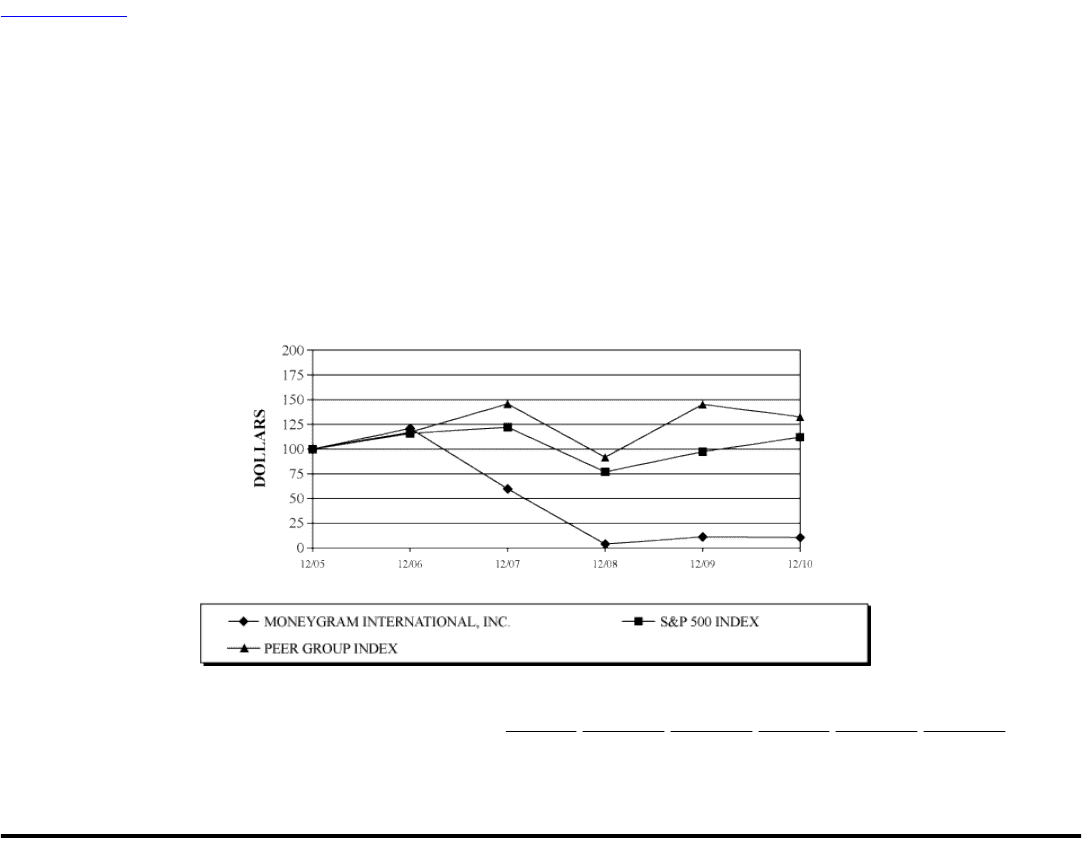
Table of Contents
STOCKHOLDER RETURN PERFORMANCE
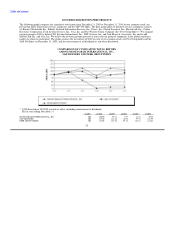
The following graph compares the cumulative total return from December 31, 2005 to December 31, 2010 for our common stock, our
peer group index of payment services companies and the S&P 500 Index. The peer group index of payment services companies consists
of: Euronet Worldwide Inc., Fidelity National Information Services, Inc., Fiserv, Inc., Global Payments Inc., MasterCard, Inc., Online
Resources Corporation, Total System Services, Inc., Visa, Inc. and The Western Union Company (the "Peer Group Index"). We changed
our peer group in 2009 to delete CSG Systems International, Inc., DST Systems, Inc. and Jack Henry & Associates, Inc. and to add
MasterCard, Inc. and Visa, Inc. We believe the new peer group represents a more relevant group of companies in the global remittance
market in which we participate. The graph assumes the investment of $100 in each of our common stock, our Peer Group Index and the
S&P 500 Index on December 31, 2005, and the reinvestment of all dividends as and when distributed.
COMPARISON OF CUMULATIVE TOTAL RETURN
AMONG MONEYGRAM INTERNATIONAL, INC.,
S&P 500 INDEX AND PEER GROUP INDEX
* $100 Invested on 12/31/05 in stock or index, including reinvestment of dividends.
Fiscal year ending December 31.
12/2005 12/2006 12/2007 12/2008 12/2009 12/2010
MONEYGRAM INTERNATIONAL, INC 100 120.90 59.81 3.97 11.21 10.55
S&P 500 INDEX 100 115.80 122.16 76.96 97.33 111.99
PEER GROUP INDEX 100 117.05 145.76 91.74 145.21 132.64
29