MoneyGram 2010 Annual Report Download - page 40
Download and view the complete annual report
Please find page 40 of the 2010 MoneyGram annual report below. You can navigate through the pages in the report by either clicking on the pages listed below, or by using the keyword search tool below to find specific information within the annual report.-
 1
1 -
2
-
3
-
4
-
5
-
6
-
7
-
8
-
9
-
10
-
11
-
12
-
13
-
14
-
15
-
16
-
17
-
18
-
19
-
20
-
21
-
22
-
23
-
24
-
25
-
26
-
27
-
28
-
29
-
 30
30 -
 31
31 -
 32
32 -
 33
33 -
 34
34 -
 35
35 -
 36
36 -
 37
37 -
 38
38 -
 39
39 -
 40
40 -
 41
41 -
 42
42 -
 43
43 -
 44
44 -
 45
45 -
 46
46 -
 47
47 -
 48
48 -
 49
49 -
 50
50 -
51
-
52
-
53
-
54
-
55
-
56
-
57
-
58
-
59
-
60
-
61
-
62
-
63
-
64
-
65
-
66
-
67
-
68
-
69
-
70
-
71
-
72
-
73
-
74
-
75
-
76
-
77
-
78
-
79
-
80
-
81
-
82
-
83
-
84
-
85
-
86
-
87
-
88
-
89
-
90
-
91
-
92
-
93
-
94
-
95
-
96
-
97
-
98
-
99
-
100
-
101
-
102
-
103
-
104
-
105
-
106
-
107
-
108
-
109
-
110
-
111
-
112
-
113
-
114
-
115
-
116
-
117
-
118
-
119
-
120
-
121
-
122
-
123
-
124
-
125
-
126
-
127
-
128
-
129
-
130
-
131
-
132
-
133
-
134
-
135
-
136
-
137
-
138
-
139
-
140
-
141
-
142
-
143
-
144
-
145
-
146
-
147
-
148
-
149
-
150
-
151
-
152
-
153
-
154
-
155
-
156
-
157
-
158
 |
 |

Table of Contents
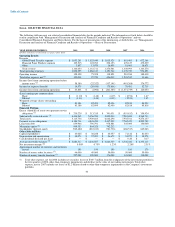
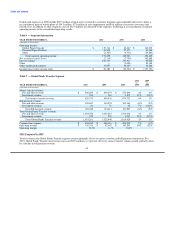
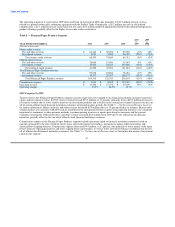
Table 3 — Net Investment Revenue Analysis
2010 2009
vs. vs.
YEAR ENDED DECEMBER 31, 2010 2009 2008 2009 2008
(Amounts in thousands)
Investment revenue $ 21,341 $ 33,219 $ 162,130 (36)% (80)%
Investment commissions expense (737) (1,362) (102,292) 46% 99%
Net investment revenue $ 20,604 $ 31,857 $ 59,838 (35)% (47)%
Average balances (1):
Cash equivalents and investments $ 3,684,317 $ 4,246,507 $ 4,866,339 (13)% (13)%
Payment service obligations 2,659,171 3,048,100 3,923,989 (13)% (22)%
Average yields earned and rates paid (2):
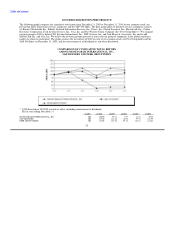
Investment yield 0.58% 0.78% 3.33%
Investment commission rate 0.03% 0.04% 2.61%
Net investment margin (2) 0.56% 0.75% 1.23%
(1) The average balances in the table reflect financial institution customers only.
(2) Average yields/rates are calculated by dividing the applicable amount of "Net investment revenue" by the applicable amount shown
in the "Average balances" section. The "Net investment margin" is calculated by dividing "Net investment revenue" by the "Cash
equivalents and investments" average balance.
Investment revenue in 2010 decreased $11.9 million, or 36 percent, compared to 2009. Lower yields earned on our investment portfolio
drove $7.5 million of the decrease, while $4.4 million of the decrease relates to lower average investment balances from the run-off of
certain official check financial institution customers terminated in prior periods.
Investment revenue in 2009 decreased $128.9 million, or 80 percent, compared to 2008 due to lower yields earned on our investment
portfolio and a decline in average investment balances from the termination of certain official check financial institution customers.
Lower yields earned on our investment balances resulted in a decrease of $110.0 million from 2008, while the decline in average
investment balances resulted in a decrease of $20.7 million. Investment revenue in 2008 also included a $10.0 million recovery of a
security that was fully impaired in 2007.
Investment commissions expense in 2010 decreased $0.6 million, or 46 percent, compared to 2009 from lower rates implemented in the
second phase of our repricing initiative in the second quarter of 2009 and lower average investment balances. Due to the continued low
federal funds rate, most of our financial institution customers continue to be in a "negative" commission position as of December 31,
2010, meaning we do not owe any commissions to our customers. While the majority of our contracts require that the financial institution
customers pay us for the negative commission amounts, we have opted at this time to impose certain per-item and other fees rather than
require payment of the negative commission amounts. We continue to monitor the negative commissions and assess our current fee
structure for possible further changes.
Investment commission expense in 2009 decreased $100.9 million, or 99 percent, compared to 2008. The decline in the federal funds rate
and our repricing initiatives resulted in a decrease of $49.7 million, while lower average investment balances resulted in a decrease of
$23.4 million. In addition, investment commissions expense for 2008 included a $27.7 million net loss from the termination of interest
rate swaps as a result of the termination of certain official check customers in 2008. See Note 6 — Derivative Financial Instruments of
the Notes to the Consolidated Financial Statements for further information regarding the interest rate swaps.
As a result of the factors discussed above, the net investment margin decreased 0.19 percentage points in 2010 and 0.48 percentage points
in 2009.
37