MoneyGram 2010 Annual Report Download - page 43
Download and view the complete annual report
Please find page 43 of the 2010 MoneyGram annual report below. You can navigate through the pages in the report by either clicking on the pages listed below, or by using the keyword search tool below to find specific information within the annual report.-
 1
1 -
2
-
3
-
4
-
5
-
6
-
7
-
8
-
9
-
10
-
11
-
12
-
13
-
14
-
15
-
16
-
17
-
18
-
19
-
20
-
21
-
22
-
23
-
24
-
25
-
26
-
27
-
28
-
29
-
30
-
31
-
32
-
 33
33 -
 34
34 -
 35
35 -
 36
36 -
 37
37 -
 38
38 -
 39
39 -
 40
40 -
 41
41 -
 42
42 -
 43
43 -
 44
44 -
 45
45 -
 46
46 -
 47
47 -
 48
48 -
 49
49 -
 50
50 -
 51
51 -
 52
52 -
 53
53 -
54
-
55
-
56
-
57
-
58
-
59
-
60
-
61
-
62
-
63
-
64
-
65
-
66
-
67
-
68
-
69
-
70
-
71
-
72
-
73
-
74
-
75
-
76
-
77
-
78
-
79
-
80
-
81
-
82
-
83
-
84
-
85
-
86
-
87
-
88
-
89
-
90
-
91
-
92
-
93
-
94
-
95
-
96
-
97
-
98
-
99
-
100
-
101
-
102
-
103
-
104
-
105
-
106
-
107
-
108
-
109
-
110
-
111
-
112
-
113
-
114
-
115
-
116
-
117
-
118
-
119
-
120
-
121
-
122
-
123
-
124
-
125
-
126
-
127
-
128
-
129
-
130
-
131
-
132
-
133
-
134
-
135
-
136
-
137
-
138
-
139
-
140
-
141
-
142
-
143
-
144
-
145
-
146
-
147
-
148
-
149
-
150
-
151
-
152
-
153
-
154
-
155
-
156
-
157
-
158
 |
 |

Table of Contents
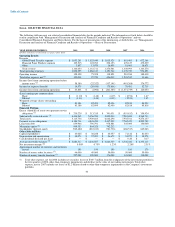
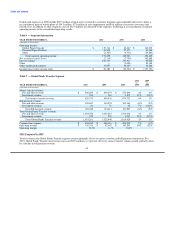
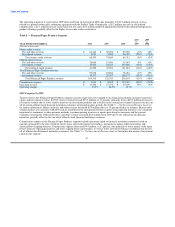
Other Expense (Income)
Table 4 — Net Securities (Gains) Losses
2010 2009
vs. vs.
YEAR ENDED DECEMBER 31, 2010 2009 2008 2009 2008
(Amounts in thousands)
Realized gains from available-for-sale investments $ — $ — $ (34,200) $ — $ 34,200
Realized losses from available-for-sale investments — 2 290,498 (2) (290,496)
Other-than-temporary impairments from available-for-sale investments 334 4,069 70,274 (3,735) (66,205)
Valuation (gains) losses on trading investments and related put options — (4,304) 14,116 4,304 (18,420)
Realized gains from trading investments and related put options (2,449) (7,557) — 5,108 (7,557)
Net securities (gains) losses $ (2,115) $ (7,790) $ 340,688 $ 5,675 $ (348,478)
Net securities gains of $2.1 million in 2010 reflect a $2.4 million realized gain from the call of a trading investment, net of the reversal of
the related put option, partially offset by $0.3 million of other-than-temporary impairments related to other asset-backed securities.
Net securities gains of $7.8 million in 2009 reflect a $7.6 million net realized gain from the call of two trading investments, net of the
reversal of the related put options. Valuation gains of $4.3 million on the put option related to the remaining trading investment were
partially offset by $4.1 million of other-than-temporary impairments related to other asset-backed securities.
Net securities losses of $340.7 million in 2008 reflect $256.3 million of net realized losses from the realignment of our investment
portfolio in the first quarter of 2008, $70.3 million of other-than-temporary impairments related to other asset-backed securities and
$40.6 million of unrealized losses from our trading investments, partially offset by a $26.5 million unrealized gain from put options
received in the fourth quarter of 2008 related to the trading investments. The other-than-temporary impairments and unrealized losses
were the result of continued deterioration in the mortgage markets, as well as continued illiquidity and uncertainty in the broader markets
in 2008. Our 2008 Recapitalization, which was completed on March 25, 2008, included funds to cover these losses.
Interest expense — Interest expense decreased to $102.1 million in 2010 from $107.9 million in 2009, reflecting lower outstanding debt
balances, partially offset by $8.6 million of pro rata write-offs of deferred financing costs and debt discount related to the $165.0 million
of debt prepayments in 2010. In 2009, we recorded a $2.7 million pro rata write-off of deferred financing costs and debt discount in
connection with the prepayment of $185.0 million of debt in 2009. Based on our outstanding debt balances and interest rates in effect at
December 31, 2010 and the expectation that we will continue to pay all interest in cash, our interest expense will be approximately
$75.0 million in 2011. This amount would be reduced by any prepayments of debt we may make in 2011.
Interest expense increased to $107.9 million in 2009 from $95.0 million in 2008 due to higher average outstanding debt as a result of the
recapitalization completed in the first quarter of 2008, partially offset by the payment of $186.9 million of debt in 2009. In addition,
interest expense in 2009 includes $2.7 million of expense from the write-off of a pro-rata portion of deferred financing costs and debt
discount in connection with the prepayment of debt in December 2009.
Income taxes — We had income tax expense of $14.6 million on pre-tax income of $58.4 million in 2010, primarily reflecting a release
of $11.9 million of valuation allowances on deferred tax assets related to the U.S. jurisdiction. Reversals and payments of 2009 legal
reserves reduced the tax base on which loss carryovers can be utilized and the corresponding release of valuation allowances.
40