MoneyGram 2010 Annual Report Download - page 108
Download and view the complete annual report
Please find page 108 of the 2010 MoneyGram annual report below. You can navigate through the pages in the report by either clicking on the pages listed below, or by using the keyword search tool below to find specific information within the annual report.-
 1
1 -
2
-
3
-
4
-
5
-
6
-
7
-
8
-
9
-
10
-
11
-
12
-
13
-
14
-
15
-
16
-
17
-
18
-
19
-
20
-
21
-
22
-
23
-
24
-
25
-
26
-
27
-
28
-
29
-
30
-
31
-
32
-
33
-
34
-
35
-
36
-
37
-
38
-
39
-
40
-
41
-
42
-
43
-
44
-
45
-
46
-
47
-
48
-
49
-
50
-
51
-
52
-
53
-
54
-
55
-
56
-
57
-
58
-
59
-
60
-
61
-
62
-
63
-
64
-
65
-
66
-
67
-
68
-
69
-
70
-
71
-
72
-
73
-
74
-
75
-
76
-
77
-
78
-
79
-
80
-
81
-
82
-
83
-
84
-
85
-
86
-
87
-
88
-
89
-
90
-
91
-
92
-
93
-
94
-
95
-
96
-
97
-
 98
98 -
 99
99 -
 100
100 -
 101
101 -
 102
102 -
 103
103 -
 104
104 -
 105
105 -
 106
106 -
 107
107 -
 108
108 -
 109
109 -
 110
110 -
 111
111 -
 112
112 -
 113
113 -
 114
114 -
 115
115 -
 116
116 -
 117
117 -
 118
118 -
119
-
120
-
121
-
122
-
123
-
124
-
125
-
126
-
127
-
128
-
129
-
130
-
131
-
132
-
133
-
134
-
135
-
136
-
137
-
138
-
139
-
140
-
141
-
142
-
143
-
144
-
145
-
146
-
147
-
148
-
149
-
150
-
151
-
152
-
153
-
154
-
155
-
156
-
157
-
158
 |
 |

Table of Contents
MONEYGRAM INTERNATIONAL, INC. AND SUBSIDIARIES
NOTES TO CONSOLIDATED FINANCIAL STATEMENTS — (Continued)
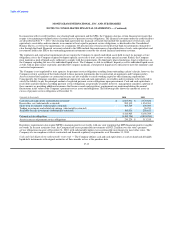
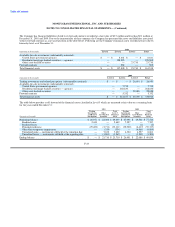
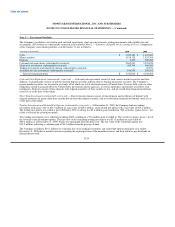
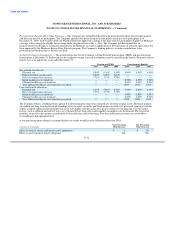
The Company has financial liabilities related to its forward contracts recorded at a fair value of $0.5 million and less than $0.1 million at
December 31, 2010 and 2009. Due to the immateriality of these amounts, the Company has presented the assets and liabilities associated
with its forward contracts as a net asset position in the table below. Following are the Company's financial assets recorded at fair value by
hierarchy level as of December 31:
2010
(Amounts in thousands) Level 1 Level 2 Level 3 Total
Available-for-sale investments (substantially restricted):
United States government agencies $ — $ 8,641 $ — $ 8,641
Residential mortgage-backed securities — agencies — 128,585 — 128,585
Other asset-backed securities — — 23,710 23,710
Forward contracts — 582 — 582
Total financial assets $ — $ 137,808 $ 23,710 $ 161,518
2009
(Amounts in thousands) Level 1 Level 2 Level 3 Total
Trading investments and related put options (substantially restricted) $ — $ — $ 26,951 $ 26,951
Available-for-sale investments (substantially restricted):
United States government agencies — 7,715 — 7,715
Residential mortgage-backed securities — agencies — 268,830 — 268,830
Other asset-backed securities — — 22,088 22,088
Forward contracts — 5,332 — 5,332
Total financial assets $ — $ 281,877 $ 49,039 $ 330,916
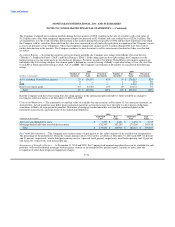
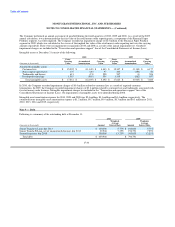
The table below provides a roll-forward of the financial assets classified in Level 3 which are measured at fair value on a recurring basis
for the years ended December 31:
2010 2009
Trading Total Trading Total
Investments Other Level 3 Investments Other Level 3
and Related Asset-Backed Financial and Related Asset-Backed Financial
(Amounts in thousands) Put Options Securities Assets Put Options Securities Assets
Beginning balance $ 26,951 $ 22,088 $ 49,039 $ 47,990 $ 29,528 $ 77,518
Realized gains 2,449 — 2,449 7,557 — 7,557
Realized losses — — — — (2) (2)
Principal paydowns (29,400) (3,711) (33,111) (32,900) (6,417) (39,317)
Other-than-temporary impairments — (334) (334) — (4,069) (4,069)
Unrealized gains — instruments still held at the reporting date — 7,632 7,632 4,304 4,557 8,861
Unrealized losses — instruments still held at the reporting date — (1,965) (1,965) — (1,509) (1,509)
Ending balance $ — $ 23,710 $ 23,710 $ 26,951 $ 22,088 $ 49,039
F-23