MoneyGram 2010 Annual Report Download - page 39
Download and view the complete annual report
Please find page 39 of the 2010 MoneyGram annual report below. You can navigate through the pages in the report by either clicking on the pages listed below, or by using the keyword search tool below to find specific information within the annual report.-
 1
1 -
2
-
3
-
4
-
5
-
6
-
7
-
8
-
9
-
10
-
11
-
12
-
13
-
14
-
15
-
16
-
17
-
18
-
19
-
20
-
21
-
22
-
23
-
24
-
25
-
26
-
27
-
28
-
 29
29 -
 30
30 -
 31
31 -
 32
32 -
 33
33 -
 34
34 -
 35
35 -
 36
36 -
 37
37 -
 38
38 -
 39
39 -
 40
40 -
 41
41 -
 42
42 -
 43
43 -
 44
44 -
 45
45 -
 46
46 -
 47
47 -
 48
48 -
 49
49 -
50
-
51
-
52
-
53
-
54
-
55
-
56
-
57
-
58
-
59
-
60
-
61
-
62
-
63
-
64
-
65
-
66
-
67
-
68
-
69
-
70
-
71
-
72
-
73
-
74
-
75
-
76
-
77
-
78
-
79
-
80
-
81
-
82
-
83
-
84
-
85
-
86
-
87
-
88
-
89
-
90
-
91
-
92
-
93
-
94
-
95
-
96
-
97
-
98
-
99
-
100
-
101
-
102
-
103
-
104
-
105
-
106
-
107
-
108
-
109
-
110
-
111
-
112
-
113
-
114
-
115
-
116
-
117
-
118
-
119
-
120
-
121
-
122
-
123
-
124
-
125
-
126
-
127
-
128
-
129
-
130
-
131
-
132
-
133
-
134
-
135
-
136
-
137
-
138
-
139
-
140
-
141
-
142
-
143
-
144
-
145
-
146
-
147
-
148
-
149
-
150
-
151
-
152
-
153
-
154
-
155
-
156
-
157
-
158
 |
 |

Table of Contents
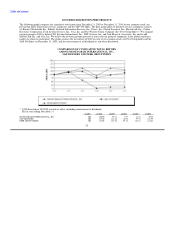
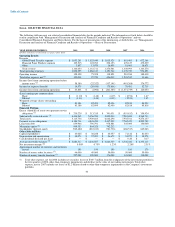
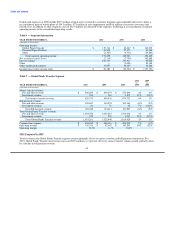
Table 2 — Fee and Other Revenue and Commissions Expense
2010 2009
vs. vs.
YEAR ENDED DECEMBER 31, 2010 2009 2008 2009 2008
(Amounts in thousands)
Fee and other revenue $ 1,145,312 $ 1,128,492 $ 1,108,451 1% 2%
Fee and other commissions expense 500,759 497,105 502,317 1% (1)%
Fee and other commissions expense as a % of fee and other revenue 43.7% 44.1% 45.3%
In 2010, fee and other revenue increased $16.8 million, or 1 percent, compared to 2009. Fee and other revenue in 2009 included
$8.3 million of incremental revenue from discontinued businesses and products, as well as $1.3 million of early agent termination fees.
Money transfer revenue drove a net increase of $35.8 million, partially offset by an $8.1 million decrease in bill payment fee and other
revenue and a $5.0 million decrease in money order fee and other revenue. Money transfer transaction volume growth of 9 percent drove
$77.4 million of incremental revenue, while changes in corridor mix increased revenue $2.4 million. Fee and other revenue decreased
$18.1 million from the lower euro exchange rate and $24.6 million from lower average money transfer fees due primarily to the
introduction of the $50 price band in the United States. Foreign exchange revenue of $113.2 million in 2010 increased $4.3 million from
2009. Bill payment revenue decreased from lower average fees per transaction due to industry mix and lower volumes. See Table 7 —
Global Funds Transfer Segment and Table 8 — Financial Paper Products Segment for further information regarding fee and other
revenue.
In 2009, fee and other revenue increased $20.0 million, or 2 percent, compared to 2008, driven by money transfer transaction volume
growth, partially offset by lower average money transfer fees, the decline in the euro exchange rate and a $6.6 million reduction in bill
payment revenue. Money transfer transaction volume increased 6 percent, generating incremental revenue of $54.5 million. Average
money transfer fees declined from lower average principal per transaction and corridor mix, reducing revenue by $15.8 million. The
decline in the euro exchange rate reduced revenue by $16.2 million in 2009. In addition, money order and official check fee and other
revenue increased $9.3 million and $5.6 million, respectively, primarily due to our repricing initiatives. Also, 2009 fee and other revenue
declined $5.9 million from 2008 due to discontinued businesses and products. Fee and other revenue for 2009 includes $108.9 million of
foreign exchange revenue, a decrease of $1.8 million from 2008.
In 2010, fee and other commissions expense increased $3.7 million, or 1 percent, from 2009 as money transfer transaction volume growth
drove incremental expense of $23.7 million, partially offset by a $7.4 million benefit from the lower euro exchange rate, a $5.4 million
decrease in expense as certain historical signing bonuses were fully amortized or written off in the prior year and a $1.2 million benefit
from lower average money transfer commission rates. Money order commissions expense decreased $1.3 million due to volume, bill
payment fee commissions decreased $2.6 million from lower volumes and average fees due to industry mix and the run-off of products
and businesses discontinued in 2009 benefited commissions expense by $1.1 million.
In 2009, fee and other commissions expense decreased $5.2 million, or 1 percent, from 2008 due to lower average money transfer
commission rates, the decline in the euro exchange rate, lower bill payment volumes and lower signing bonus amortization, partially
offset by money transfer volume growth. Incremental fee commissions of $16.1 million resulting from money transfer transaction volume
growth was significantly offset by a decrease of $7.7 million from lower average commission rates and $7.6 million from the decline in
the euro exchange rate. Bill payment volume declines reduced commissions expense by $3.8 million and signing bonus amortization
decreased by $2.0 million as certain historical signing bonuses were fully amortized in the third quarter of 2009.
36