MoneyGram 2010 Annual Report Download - page 33
Download and view the complete annual report
Please find page 33 of the 2010 MoneyGram annual report below. You can navigate through the pages in the report by either clicking on the pages listed below, or by using the keyword search tool below to find specific information within the annual report.-
 1
1 -
2
-
3
-
4
-
5
-
6
-
7
-
8
-
9
-
10
-
11
-
12
-
13
-
14
-
15
-
16
-
17
-
18
-
19
-
20
-
21
-
22
-
 23
23 -
 24
24 -
 25
25 -
 26
26 -
 27
27 -
 28
28 -
 29
29 -
 30
30 -
 31
31 -
 32
32 -
 33
33 -
 34
34 -
 35
35 -
 36
36 -
 37
37 -
 38
38 -
 39
39 -
 40
40 -
 41
41 -
 42
42 -
 43
43 -
44
-
45
-
46
-
47
-
48
-
49
-
50
-
51
-
52
-
53
-
54
-
55
-
56
-
57
-
58
-
59
-
60
-
61
-
62
-
63
-
64
-
65
-
66
-
67
-
68
-
69
-
70
-
71
-
72
-
73
-
74
-
75
-
76
-
77
-
78
-
79
-
80
-
81
-
82
-
83
-
84
-
85
-
86
-
87
-
88
-
89
-
90
-
91
-
92
-
93
-
94
-
95
-
96
-
97
-
98
-
99
-
100
-
101
-
102
-
103
-
104
-
105
-
106
-
107
-
108
-
109
-
110
-
111
-
112
-
113
-
114
-
115
-
116
-
117
-
118
-
119
-
120
-
121
-
122
-
123
-
124
-
125
-
126
-
127
-
128
-
129
-
130
-
131
-
132
-
133
-
134
-
135
-
136
-
137
-
138
-
139
-
140
-
141
-
142
-
143
-
144
-
145
-
146
-
147
-
148
-
149
-
150
-
151
-
152
-
153
-
154
-
155
-
156
-
157
-
158
 |
 |
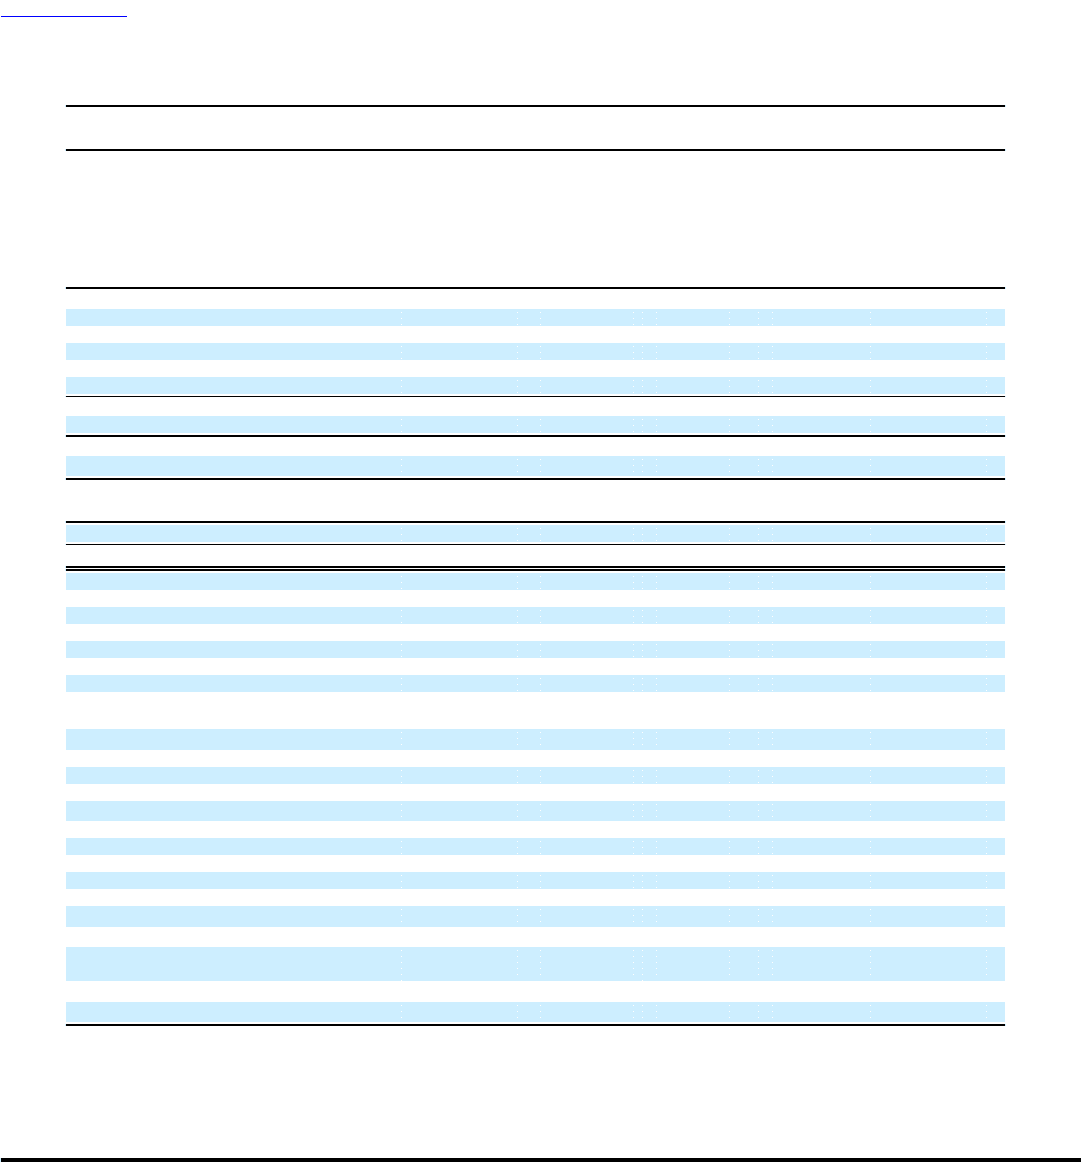
Table of Contents
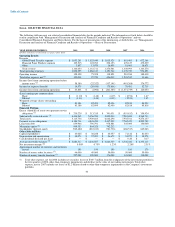
Item 6. SELECTED FINANCIAL DATA
The following table presents our selected consolidated financial data for the periods indicated. The information set forth below should be
read in conjunction with "Management's Discussion and Analysis of Financial Condition and Results of Operations" and our
Consolidated Financial Statements and Notes thereto. For the basis of presentation of the information set forth below, see "Management's
Discussion and Analysis of Financial Condition and Results of Operations — Basis of Presentation."
YEAR ENDED DECEMBER 31, 2010 2009 2008 2007 2006
(Dollars and shares in thousands, except per share data)
Operating Results
Revenue
Global Funds Transfer segment $ 1,053,281 $ 1,025,449 $ 1,015,929 $ 861,403 $ 672,366
Financial Paper Products segment 109,515 122,783 238,193 470,127 472,239
Other 3,857 13,479 16,459 18,463 18,671
Total revenue 1,166,653 1,161,711 1,270,581 1,349,993 1,163,276
Total operating expenses 1,008,255 1,086,313 1,151,760 1,139,749 974,858
Operating income 158,398 75,398 118,821 210,244 188,418
Total other expense, net (1) 100,018 97,720 456,012 1,203,512 11,646
Income (loss) from continuing operations before
income taxes (2) 58,380 (22,322) (337,191) (993,268) 176,772
Income tax expense (benefit) 14,579 (20,416) (75,806) 78,481 52,719
Income (loss) from continuing operations $ 43,801 $ (1,906) $ (261,385) $ (1,071,749) $ 124,053
(Loss) earnings per common share:
Basic $ (1.10) $ (1.48) $ (4.19) $ (12.94) $ 1.47
Diluted $ (1.10) (1.48) (4.19) (12.94) 1.45
Weighted-average shares outstanding:
Basic 83,186 82,499 82,456 82,818 84,294
Diluted 83,186 82,499 82,456 82,818 85,818
Financial Position
Excess (shortfall) of assets over payment service
obligations (3) $ 230,229 $ 313,335 $ 391,031 $ (551,812) $ 358,924
Substantially restricted assets (3) 4,414,965 5,156,789 5,829,030 7,210,658 8,568,713
Total assets 5,115,736 5,929,663 6,642,296 7,935,011 9,276,137
Payment service obligations 4,184,736 4,843,454 5,437,999 7,762,470 8,209,789
Long-term debt 639,946 796,791 978,881 345,000 150,000
Mezzanine equity (4) 999,353 864,328 742,212 — —
Stockholders' (deficit) equity (942,482) (883,013) (781,736) (488,517) 669,063
Other Selected Data
Capital expenditures $ 43,025 $ 38,258 $ 40,357 $ 71,142 $ 81,033
Depreciation and amortization $ 48,074 $ 57,091 $ 56,672 $ 51,979 $ 38,978
Cash dividends declared per share $ — $ — $ — $ 0.20 $ 0.17
Average investable balances (5) $ 3,684,317 $ 4,246,507 $ 4,866,339 $ 6,346,442 $ 6,333,115
Net investment margin (6) 0.56% 0.75% 1.23% 2.28% 2.31%
Approximate number of countries and territories
served 190 190 190 180 170
Number of money order locations (7) 46,000 49,000 59,000 59,000 55,000
Number of money transfer locations (7) 227,000 190,000 176,000 143,000 110,000
(1) Total other expense, net for 2008 includes net securities losses of $340.7 million from the realignment of the investment portfolio in
the first quarter of 2008, other-than-temporary impairments and declines in the value of our trading investments. Total other
expense, net for 2007 includes net losses of $1.2 billion related to other-than-temporary impairments in the Company's investment
portfolio.
30