MoneyGram 2010 Annual Report Download - page 110
Download and view the complete annual report
Please find page 110 of the 2010 MoneyGram annual report below. You can navigate through the pages in the report by either clicking on the pages listed below, or by using the keyword search tool below to find specific information within the annual report.-
 1
1 -
2
-
3
-
4
-
5
-
6
-
7
-
8
-
9
-
10
-
11
-
12
-
13
-
14
-
15
-
16
-
17
-
18
-
19
-
20
-
21
-
22
-
23
-
24
-
25
-
26
-
27
-
28
-
29
-
30
-
31
-
32
-
33
-
34
-
35
-
36
-
37
-
38
-
39
-
40
-
41
-
42
-
43
-
44
-
45
-
46
-
47
-
48
-
49
-
50
-
51
-
52
-
53
-
54
-
55
-
56
-
57
-
58
-
59
-
60
-
61
-
62
-
63
-
64
-
65
-
66
-
67
-
68
-
69
-
70
-
71
-
72
-
73
-
74
-
75
-
76
-
77
-
78
-
79
-
80
-
81
-
82
-
83
-
84
-
85
-
86
-
87
-
88
-
89
-
90
-
91
-
92
-
93
-
94
-
95
-
96
-
97
-
98
-
99
-
 100
100 -
 101
101 -
 102
102 -
 103
103 -
 104
104 -
 105
105 -
 106
106 -
 107
107 -
 108
108 -
 109
109 -
 110
110 -
 111
111 -
 112
112 -
 113
113 -
 114
114 -
 115
115 -
 116
116 -
 117
117 -
 118
118 -
 119
119 -
 120
120 -
121
-
122
-
123
-
124
-
125
-
126
-
127
-
128
-
129
-
130
-
131
-
132
-
133
-
134
-
135
-
136
-
137
-
138
-
139
-
140
-
141
-
142
-
143
-
144
-
145
-
146
-
147
-
148
-
149
-
150
-
151
-
152
-
153
-
154
-
155
-
156
-
157
-
158
 |
 |
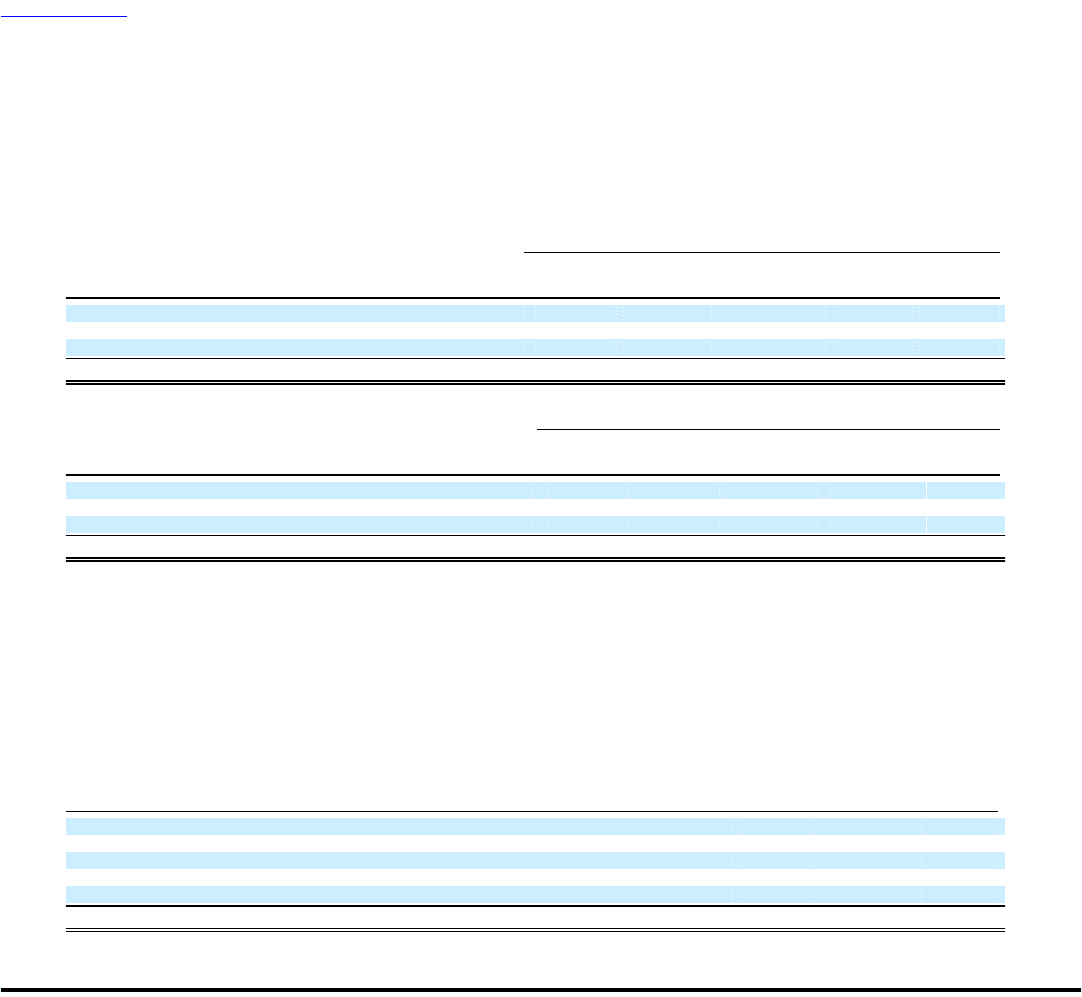
Table of Contents
MONEYGRAM INTERNATIONAL, INC. AND SUBSIDIARIES
NOTES TO CONSOLIDATED FINANCIAL STATEMENTS — (Continued)
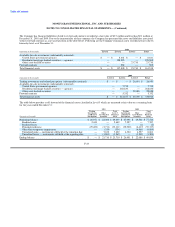
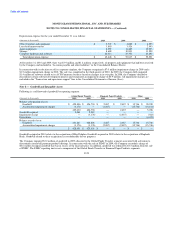
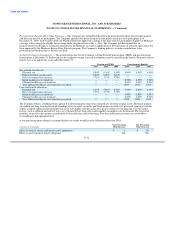
Available-for-sale Investments (substantially restricted) — Available-for-sale investments consist of mortgage-backed securities, asset-
backed securities and agency debenture securities. After other-than-temporary impairment charges, the amortized cost and fair value of
available-for-sale investments are as follows at December 31:
2010
Gross Gross Net
Amortized Unrealized Unrealized Fair Average
(Amounts in thousands, except net average price) Cost Gains Losses Value Price
Residential mortgage-backed securities-agencies $ 121,677 $ 7,001 $ (93) $ 128,585 $ 106.37
Other asset-backed securities 10,690 13,020 — 23,710 4.68
United States government agencies 7,273 1,368 — 8,641 96.01
Total $ 139,640 $ 21,389 $ (93) $ 160,936 $ 25.27
2009
Gross Gross Net
Amortized Unrealized Unrealized Fair Average
(Amounts in thousands, except net average price) Cost Gains Losses Value Price
Residential mortgage-backed securities — agencies $ 259,563 $ 9,296 $ (29) $ 268,830 $ 104.13
Other asset-backed securities 15,706 6,382 — 22,088 3.74
United States government agencies 6,854 861 — 7,715 85.72
Total $ 282,123 $ 16,539 $ (29) $ 298,633 $ 34.84
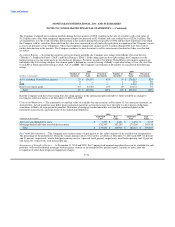
At December 31, 2010 and 2009, approximately 85 percent and 93 percent, respectively, of the available-for-sale portfolio is invested in
debentures of United States government agencies or securities collateralized by United States government agency debentures. These
securities have always had the implicit backing of the United States government and the Company expects to receive full par value upon
maturity or pay-down, as well as all interest payments. The Other asset-backed securities continue to have market exposure. The
Company has factored this risk into its fair value estimates, with the average price of an asset-backed security at $0.05 per dollar of par at
December 31, 2010.
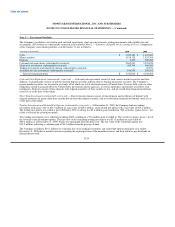
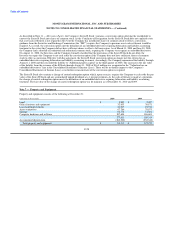
Gains and Losses and Other-Than-Temporary Impairments — At December 31, 2010 and 2009, net unrealized gains of $21.3 million
and $16.5 million, respectively, are included in the Consolidated Balance Sheets in "Accumulated other comprehensive loss." During
2010, 2009 and 2008, net losses of $0.3 million, $4.1 million and $326.6 million, respectively, were reclassified from "Accumulated
other comprehensive loss" to "Net securities (gains) losses" in connection with other-than-temporary impairments and realized gains and
losses recognized during the year. "Net securities (gains) losses" were as follows for the year ended December 31:
(Amounts in thousands) 2010 2009 2008
Realized gains from available-for-sale investments $ — $ — $ (34,200)
Realized losses from available-for-sale investments — 2 290,498
Other-than-temporary impairments from available-for-sale investments 334 4,069 70,274
Valuation (gains) losses on trading investments and related put options — (4,304) 14,116
Realized gains from trading investments and related put options (2,449) (7,557) —
Net securities (gains) losses $ (2,115) $ (7,790) $ 340,688
F-25